06 Distance
This tutorial will ask you to use the roadways of New York City to calculate a route between campus and Union Square. You will use various attributes of the road network dataset to find an optimal route base on your criteria.
Deliverables
Please submit one 11 x 17 map expressing each of the three routes you develop through this exercise, complete with a legend and other key map elements.
Data
- Download a subset of the City’s LION database from here.
- A point shapefile representing the southeast corner of Union Square to use as a destination.
Getting Started
Open a new QGIS project, and add your data. This dataset has already been filtered to only include road types that could be used for pedestrian or bike access- all other paper street, administrative, rail lines, bridges, and tunnels maintained in this dataset have already been removed using the RW_TYPE field and the metadata linked above. Bridges were included as well in part because this exercise will focus on traversing Manhattan.
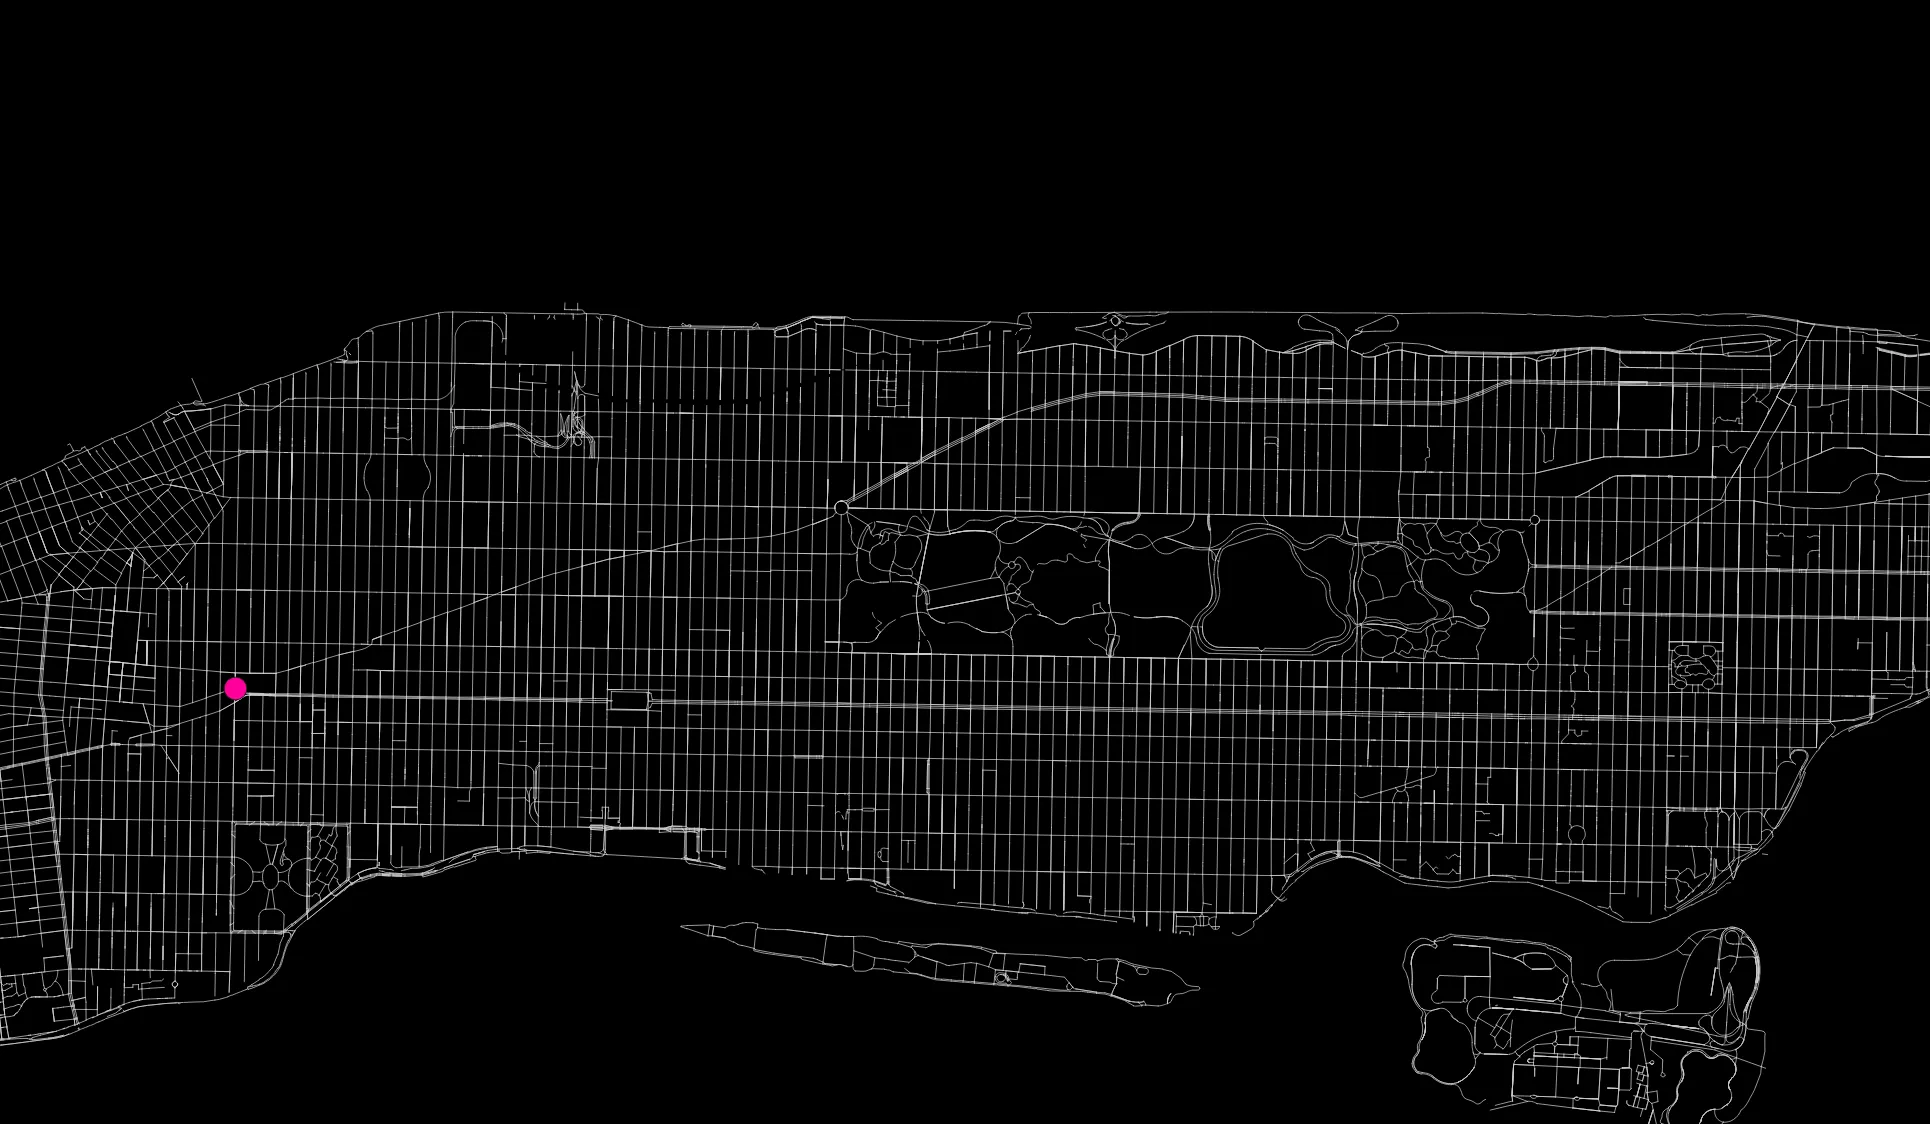
(Optional) Apply a rotation to your map canvas for a different perspective. 62 degrees will flip Manhattan on its side.
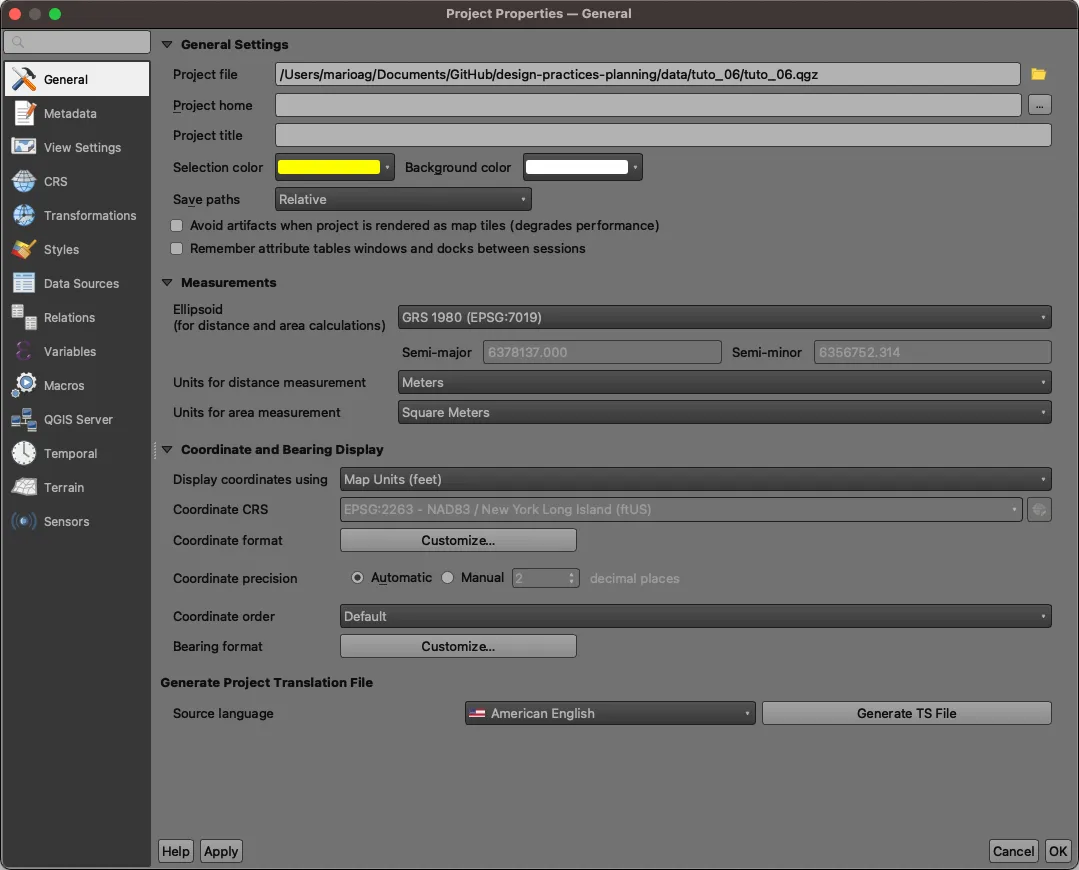
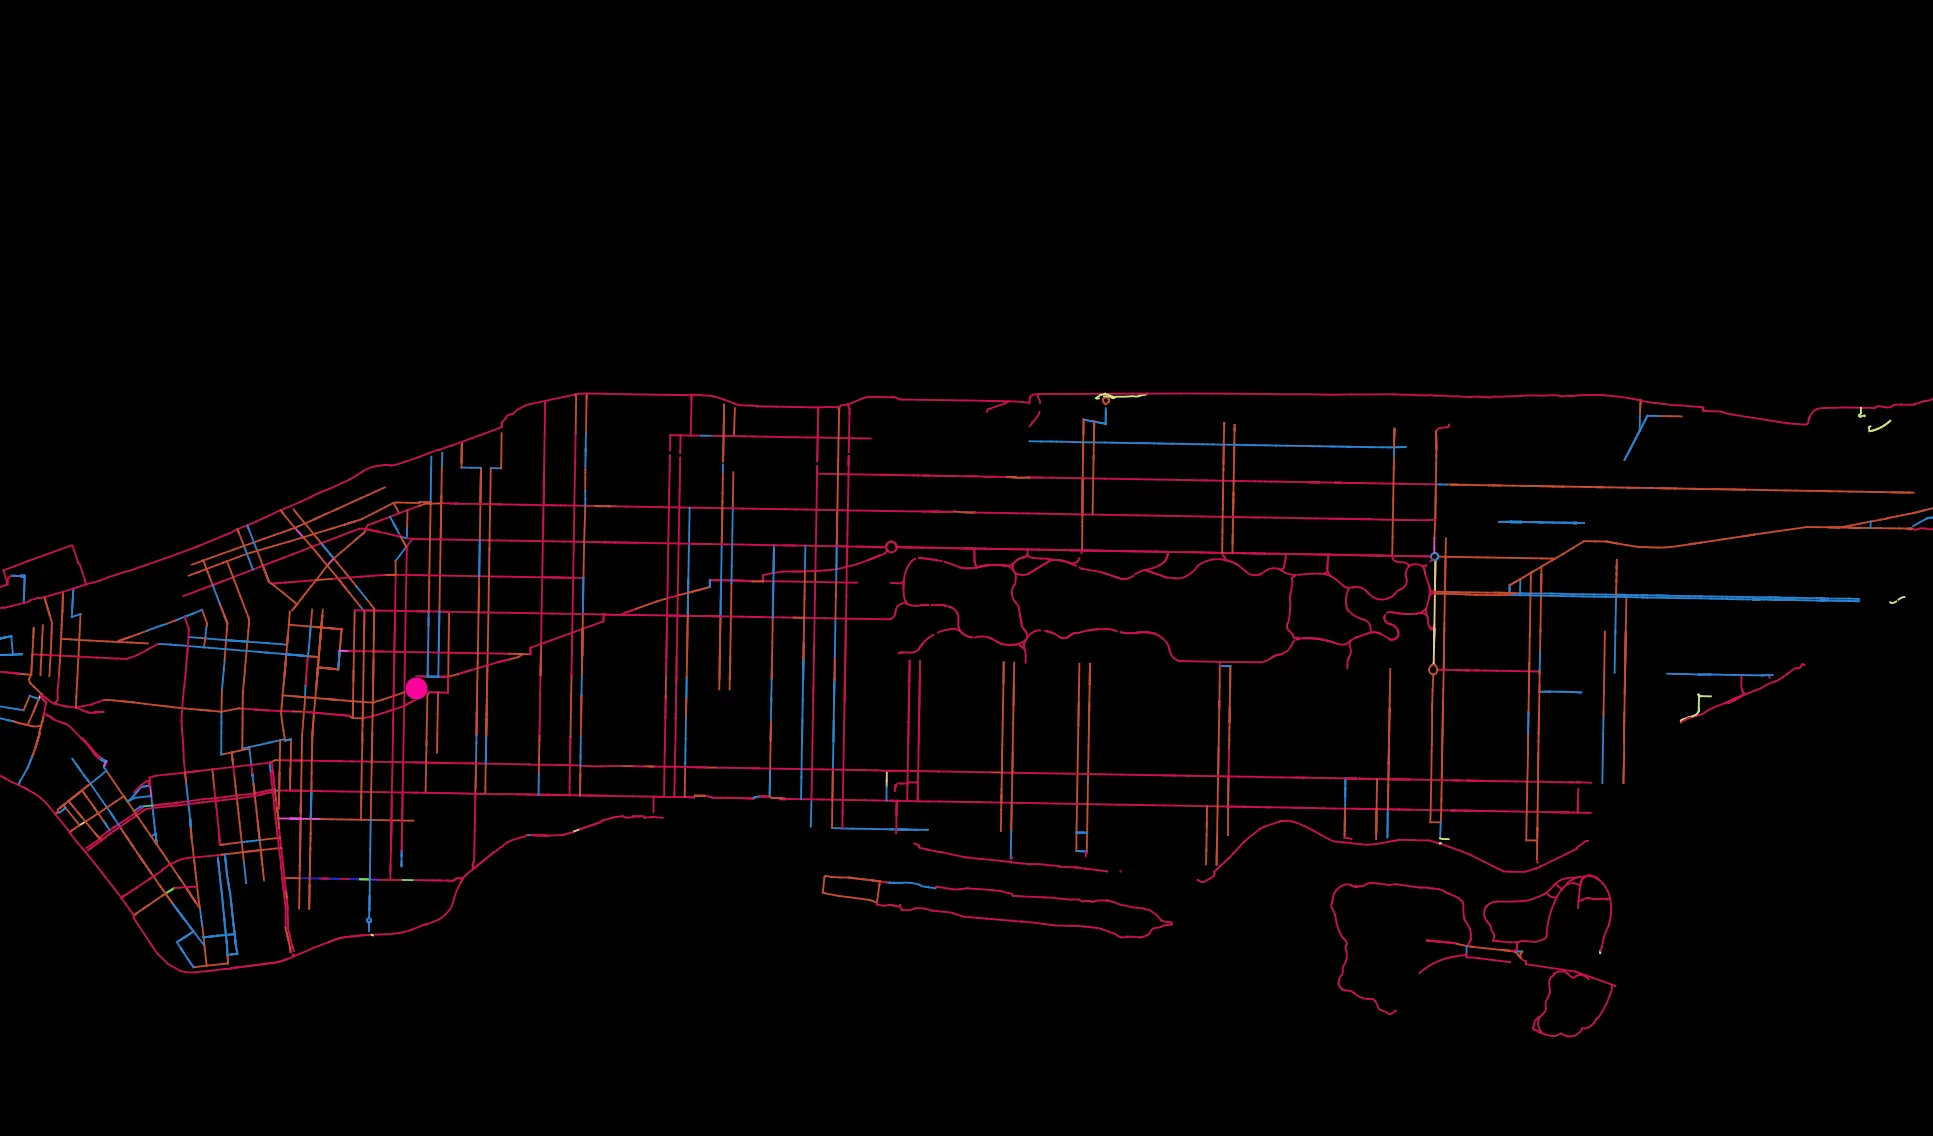
YOu can also click Project > Properties... > General and change the background color. In this example, we will change the background to black for a different kind of representation, but feel free to maintain whatever style you’d like for the exercise.
Creating a baseline
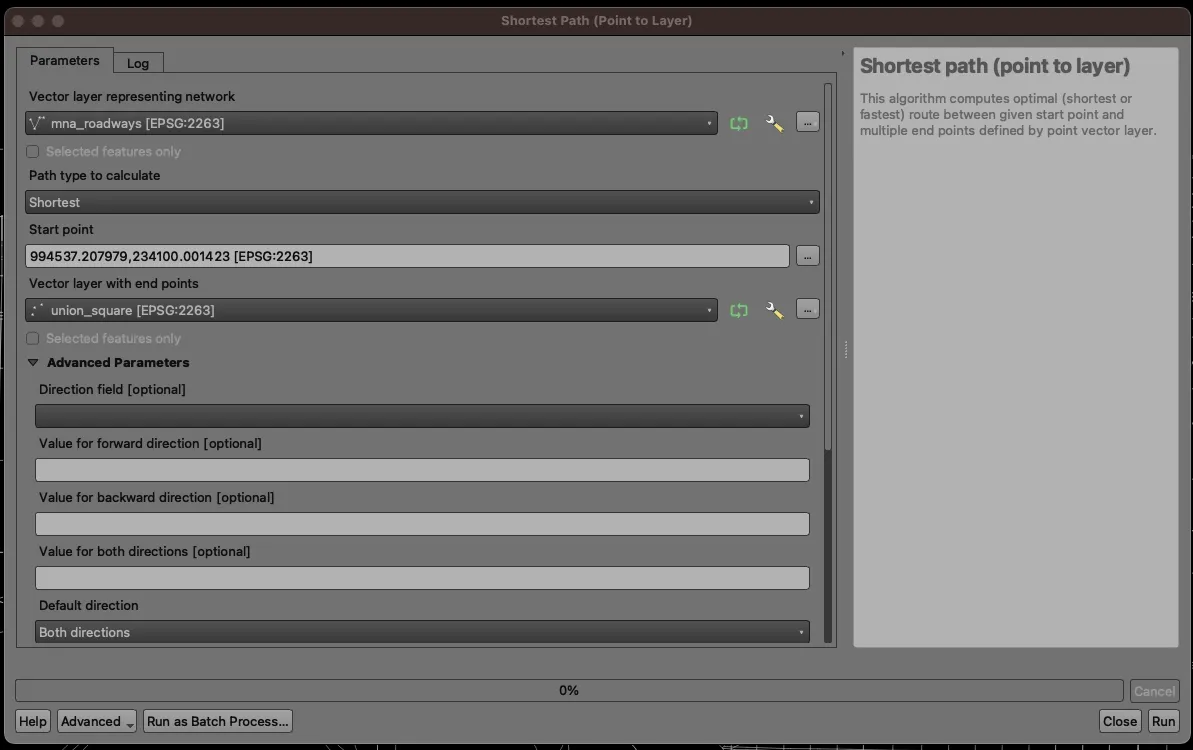
Open the Processing Toolbox. Search for “network analysis”, and then select Shortest path (point to layer). Launch the tool. Ensure the roadways layer is selected as the network layer and that the Union Square point is selected as the end points layer. In the Start point input, you’ll notice an ellipse button [...] near the right side of the window. Click on that, and then click on the map near campus to create the starting point for your network analysis. Select an output location at the bottom of the scrolling window, and click Run. Close the window upon success, and change the line symbology so you can clearly see it.
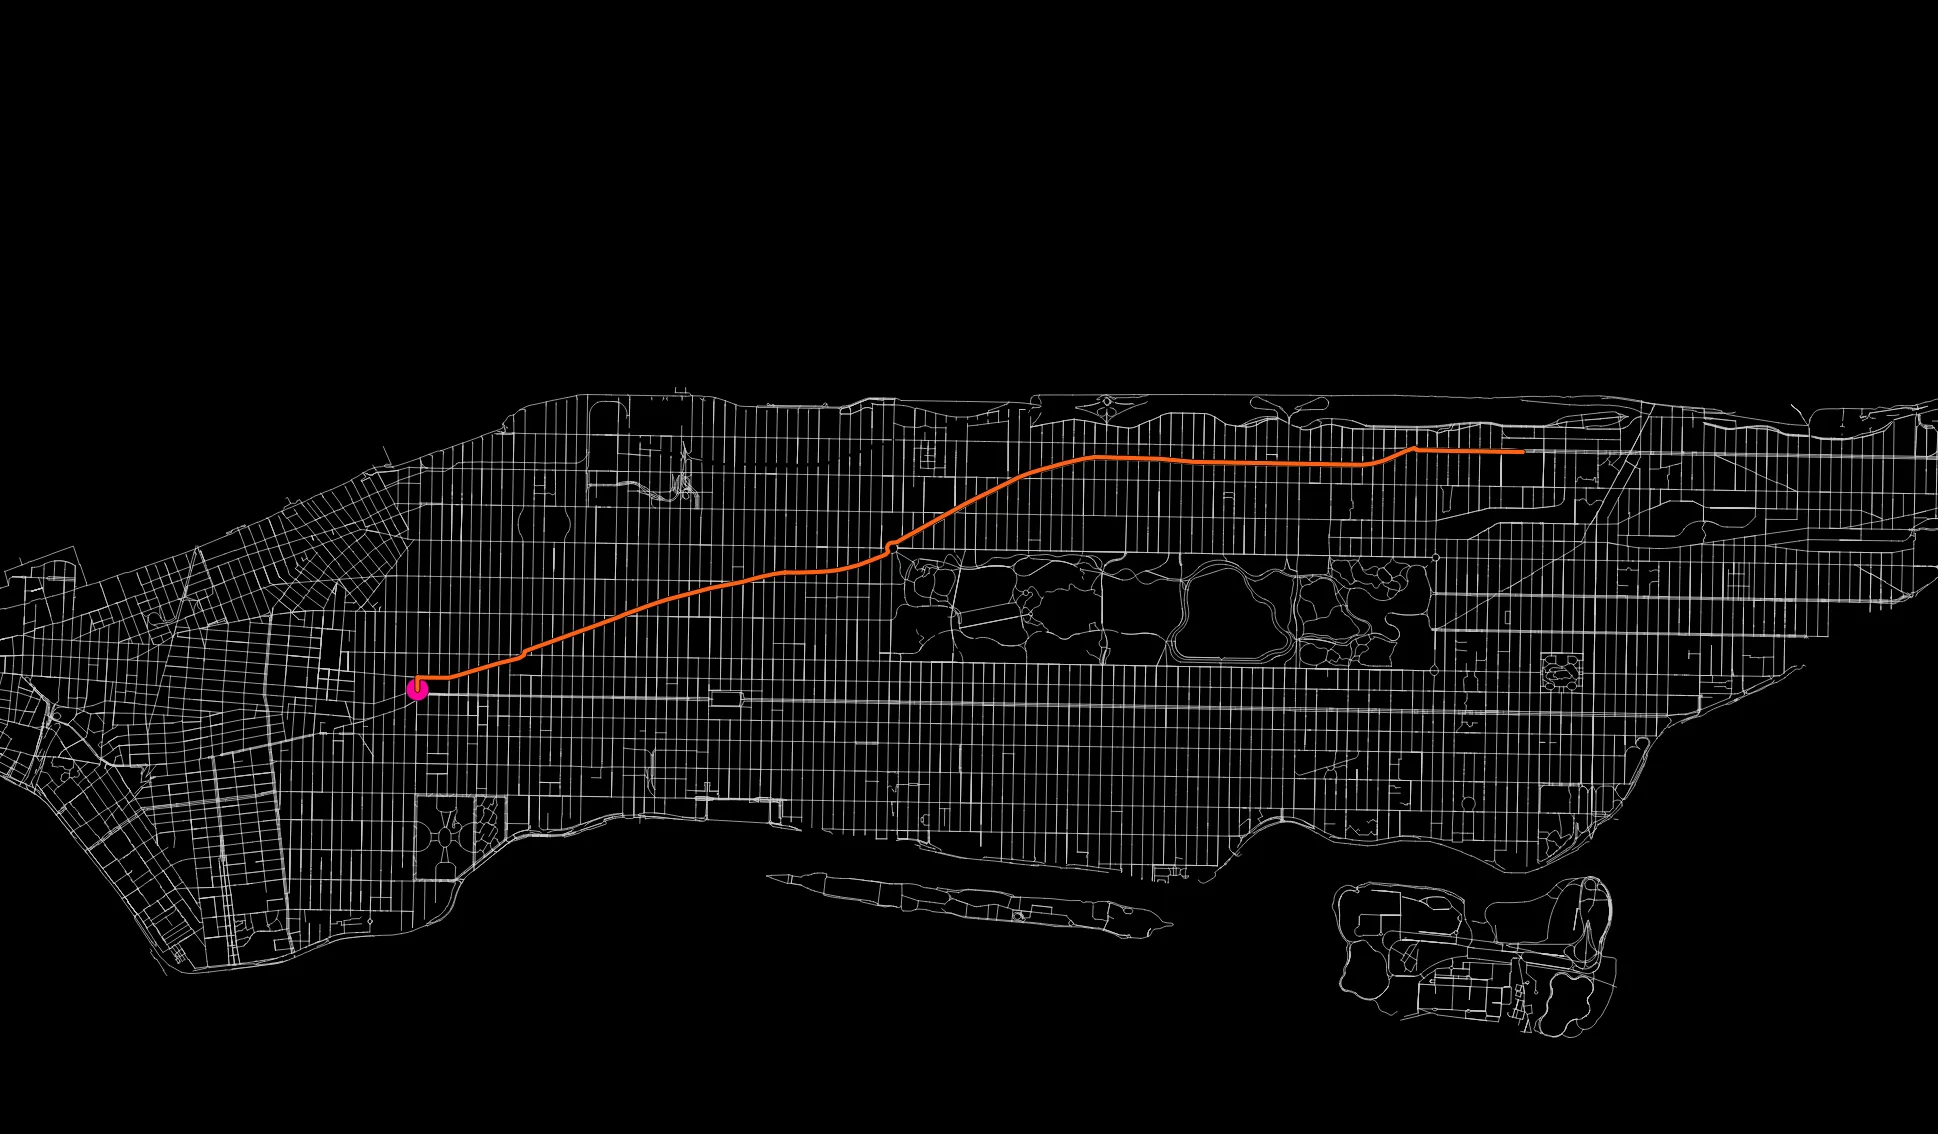
As we might expect, the shortest path between campus and Union Square is down Broadway.
Restricting our network
Let’s assume we are interested in biking to Union Square, and want to chart a course that follows a bike lane the entire way. Copy the roadways layer, and change the symbology to Categorized. Select the BikeLane field, and uncheck the last box (which represents roadways with no bike lanes). You should see the (incomplete) bike network of Manhattan.
Let’s assume further that we want to maximize time spend on a separated bike lane, with a secondary preference for a striped bike lane and minimal tolerance for a shared lane. (For details on the kinds of bike lanes and the corresponding codes, see the LION metadata)
Let’s create a field to codify these preferences. Open the copied layer’s attribute table, and select the abacus button to create a new field. Name the field bikePref and paste in the following expression:
CASEWHEN "BikeLane" = '1' THEN 7WHEN "BikeLane" = '2' THEN 5WHEN "BikeLane" = '3' THEN 3WHEN "BikeLane" = not Null THEN 2else 1ENDThis assigns the highest preference to single-type lanes per the preferences above, but still also prefers some kind of bike lane over no bike lane. We leave the default value as 1 to avoid errors with our network topology.
Calculate the most well-suited path
Open the Shortest path (point to layer) tool again. This time, select Fastest as the path type to calculate. Add the copied (attributed) roadway layer, and add a point near campus again. Scroll down and select the new bikePref field as the speed field. Give your output a name and run the result. Visualize the network so that you can see it, and compare it with the first (shortest) path.
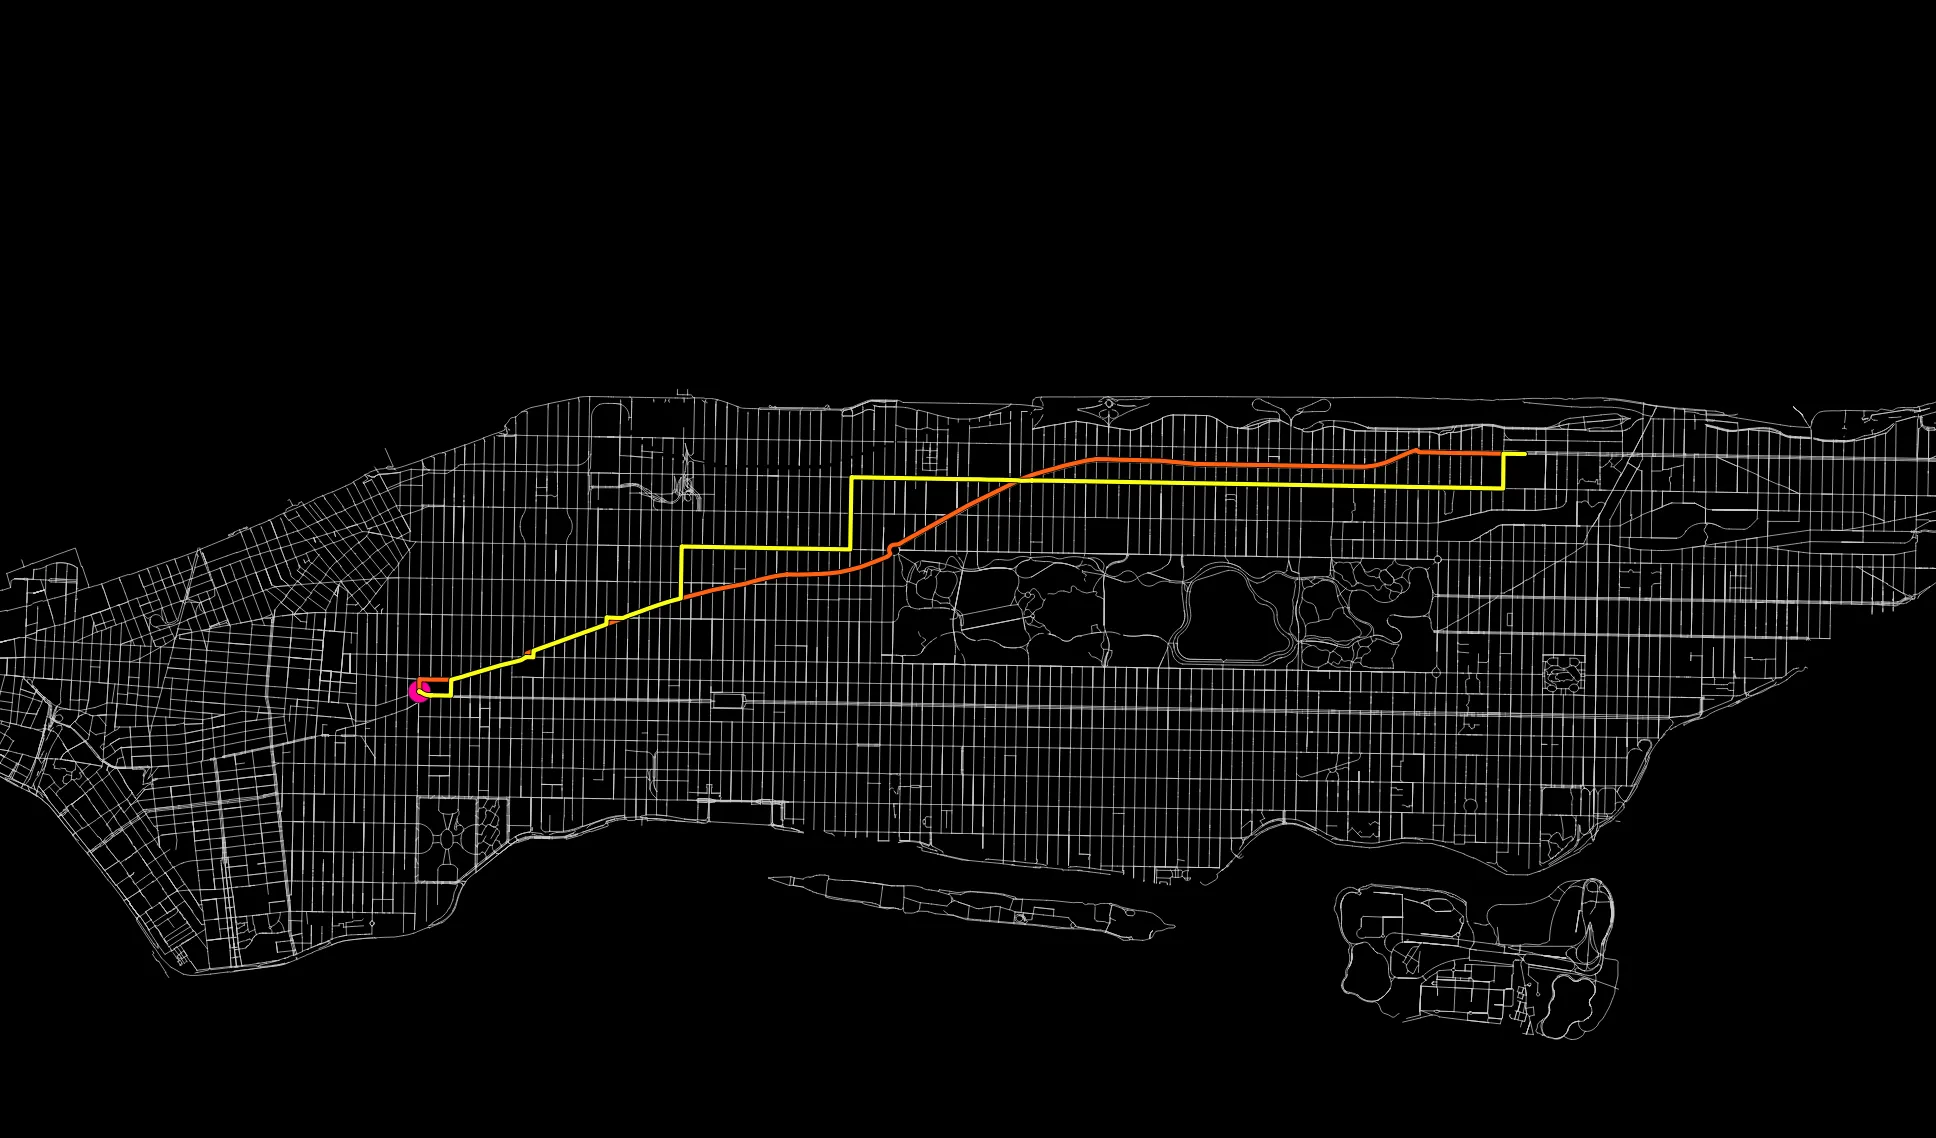
Although this path travels a greater distance, it is “Fastest” or most advantageous based on our values.
Experiment with another variable, and submit a map that shows the three different pathways from campus to Union Square. Other variables you may explore are Posted Speed, Truck Routes, or Roadway Type, among others. You can either use the values given directly in the table, so long as they are numeric and there is a value for each row. You may have to reassign values like we did in the example above.
Deliverables
One 11x17 map showing three different routes between campus and Union Square.