08.1 Interactive Mapping Part 1
This tutorial will have you set up a programming environment such that you will be able to produce html / css / javascript-based map assets in later assignments and your final project. You will also use an open-source tool to develop a map style for web mapping.
Deliverables
Your Github username and a style.json file for your basemap style.
Data
- None
Getting Started
While not strictly necessary, it is common practice to use the version control system Git for use in programming. Beyond being a means to save snapshots of a code base over time, it offers powerful tools for resolving conflicts between files which is especially useful when the team contributing to the codebase grows. Github is an industry-leading for-profit company that offers a free service to host code repositories, as well as paid services for more advanced and enterprise features. It was acquired by Microsoft in 2018. It offers a web-based interface for managing repositories, but also offers a desktop application that can be used to manage repositories on your local machine. For exercises in this course, we will use both. Github also offers free web hosting for static websites, which we will use in later exercises.
- Download and install the Github Desktop application.
- Create a Github account if you do not already have one.
- Open the Github Desktop application and sign in.
Download a text editor
For this exercise, we will use the text editor Visual Studio Code. This is a free, open-source text editor that is widely used in the programming community. It offers a range of features that make it well-suited for web development, including syntax highlighting, code completion, and debugging tools. There are a number of alternatives at your disposal, including free options such as Sublime Text, Atom, and Notepad++, and (paid) AI-powered options like Cursor.
Setting up a map style
There are several options for creating a map style, but we will use the open-source tool Maputnik. This tool allows you to create a map style using the Mapbox GL style specification, which is a JSON object that describes the visual appearance of a map. This style specification can be used with the Mapbox GL JS library to create interactive web maps, as well as MapLibre GL, which is a fork of the Mapbox GL JS library that is free and open-source. We will focus examples on Maplibre, but the same principles apply to the Mapbox library.
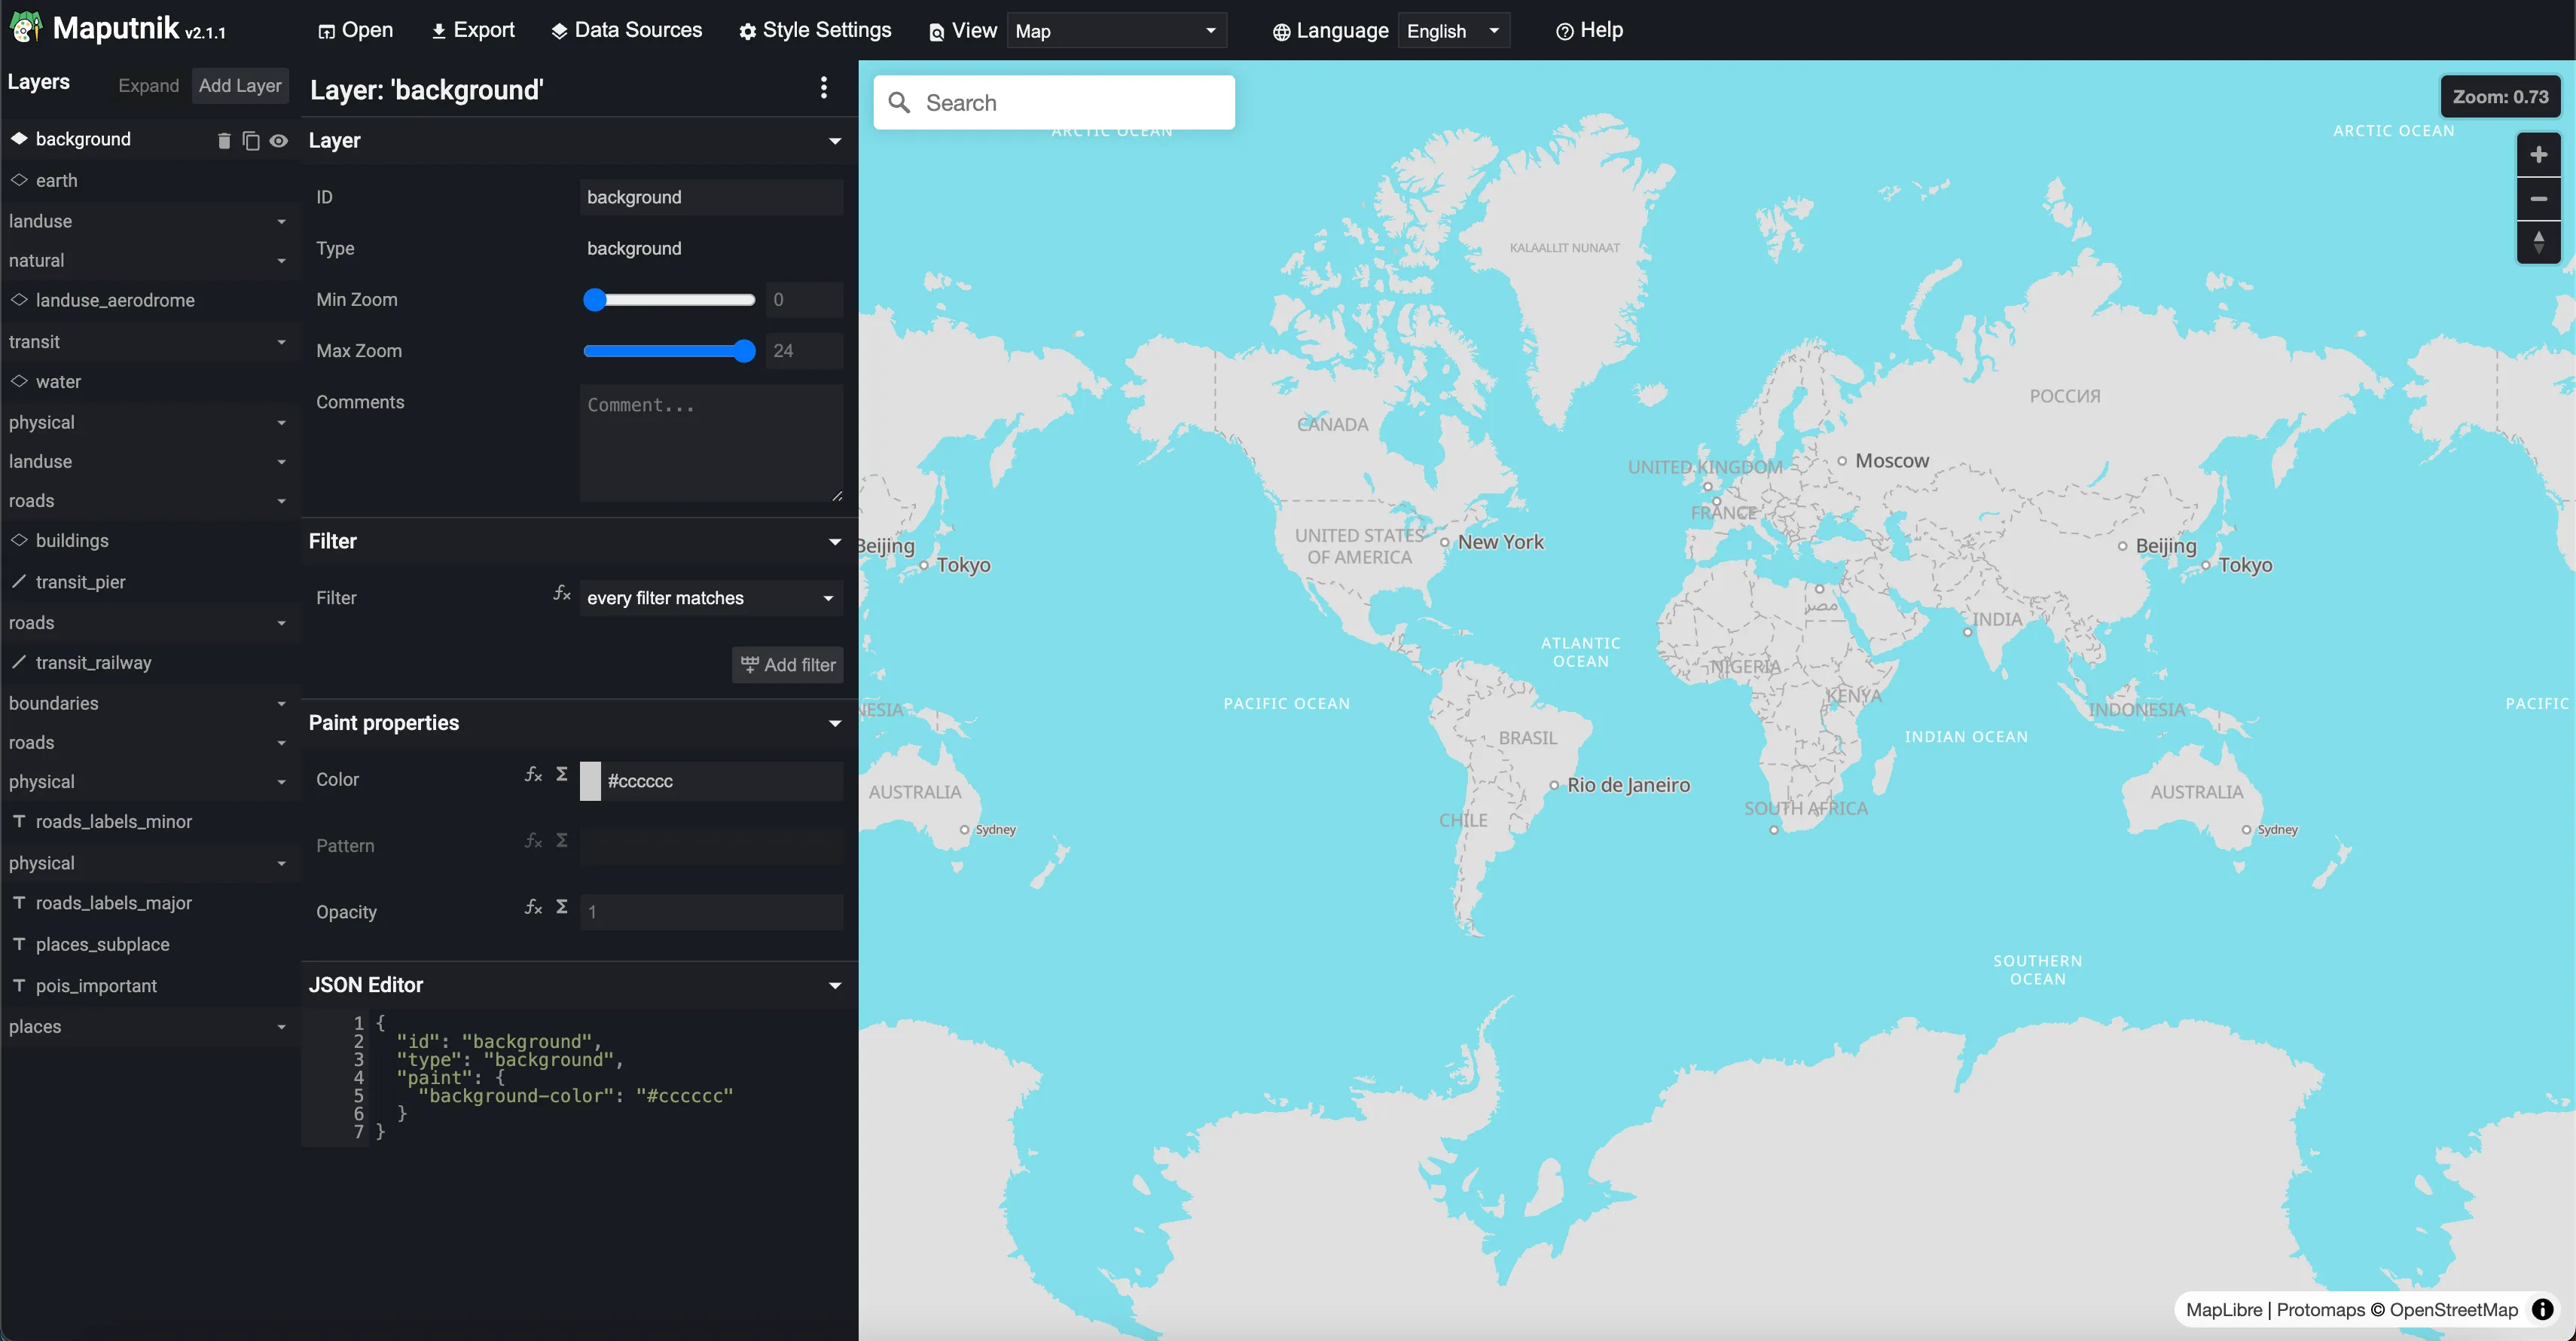
Open the Maputnik website. You’ll see a map of the world, as well as a side-panel interface for editing the map style.

Click “Open” at the top. From here, you can see a range of other starting options, including a blank slate, a template, or a style from a URL. You’ll notice there is also an option to upload a style- as your project develops over the coming weeks, you can re-upload your style here to further refine it. Choose a template to start with, and return to the main interface.
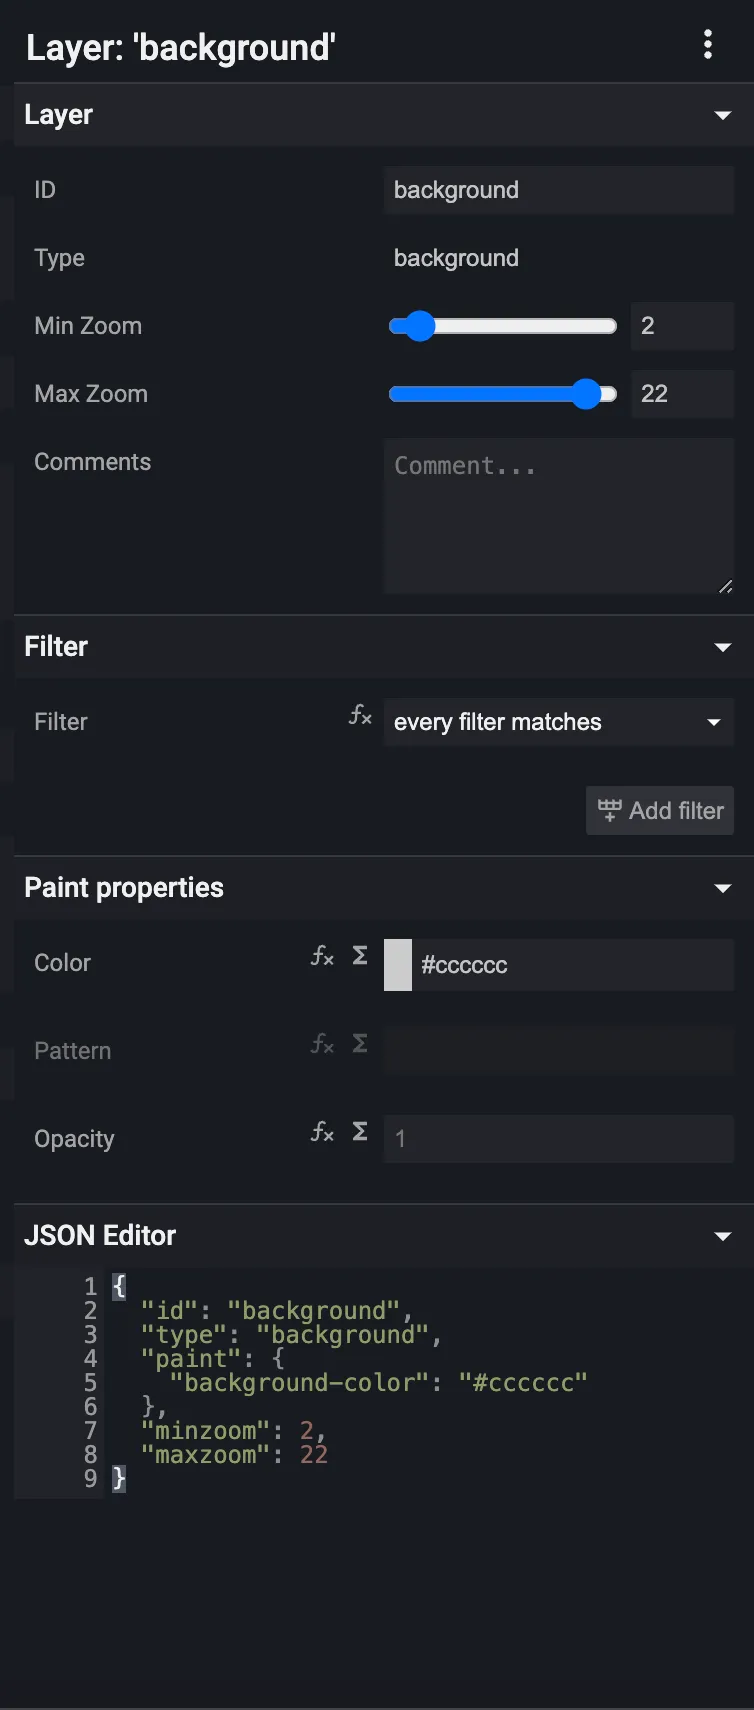
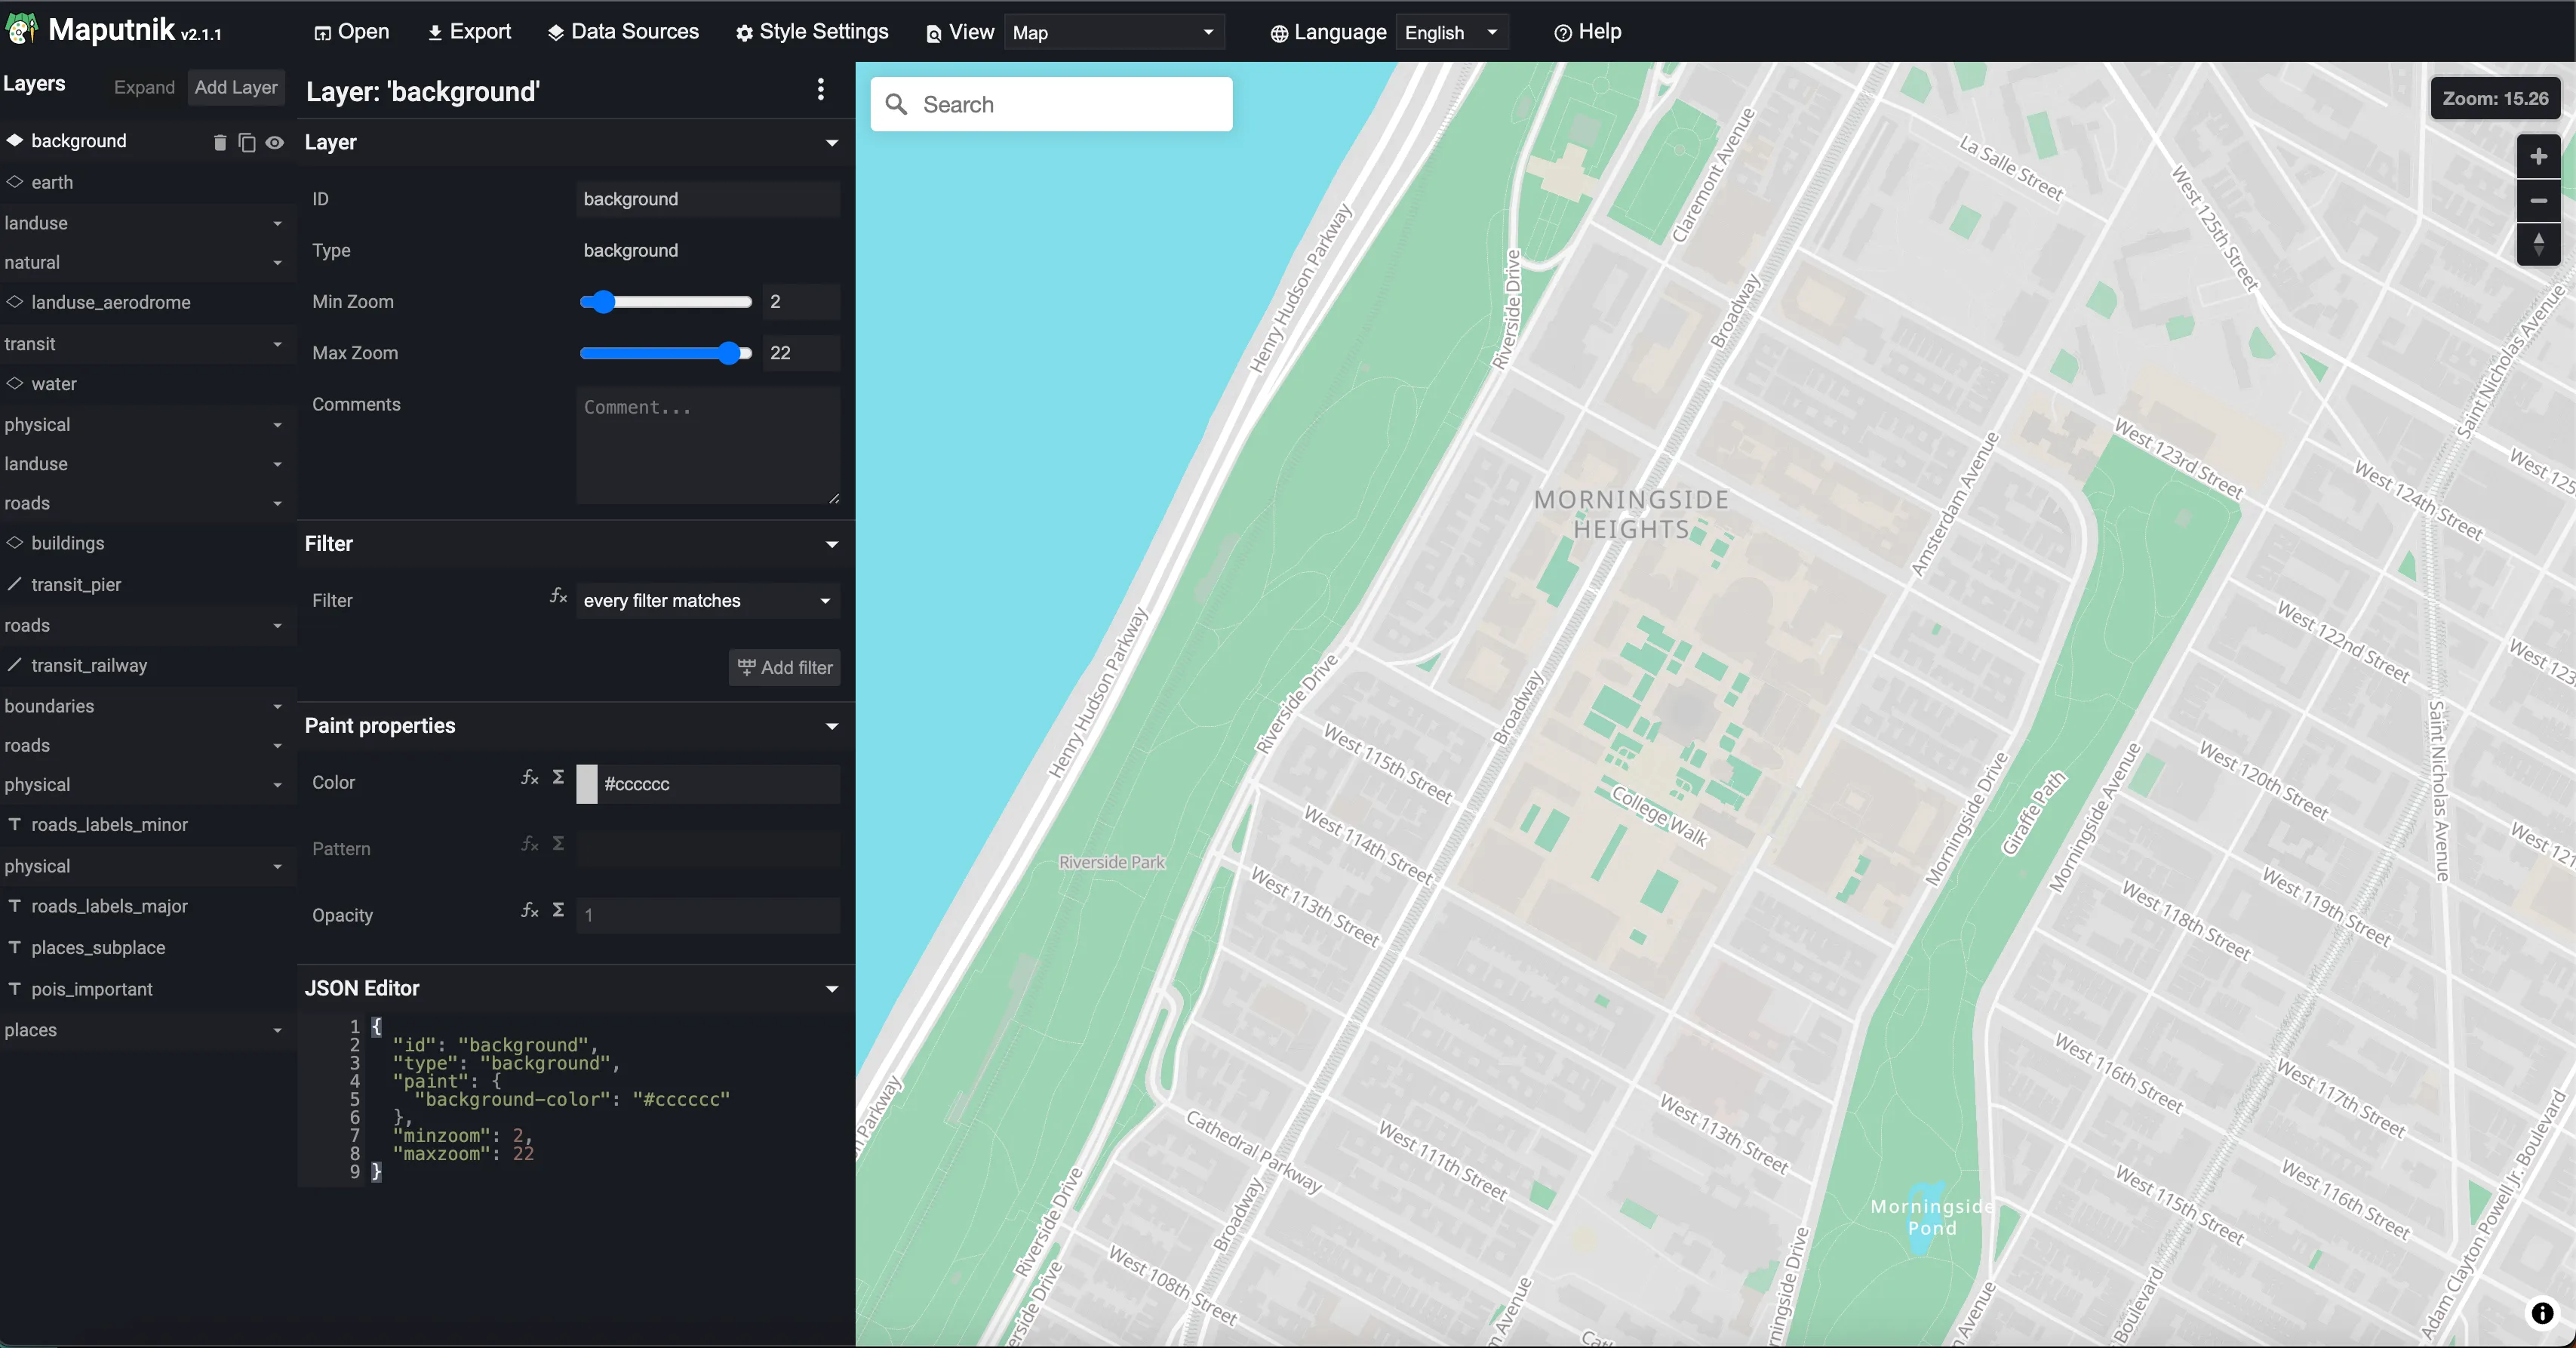
The left panel provides different ways to edit the style, including using sliders, input boxes, and color pickers, as well as the JSON editor for more advanced users. The right panel shows the map preview, which updates in real-time as you make changes to the style. Note that as you change either of the JSON or the visual editor, the other will update in real-time.

Zoom in to wherever in the world your project is located. You can use the search bar at the top to find a specific location.

As you make style decisions, you should keep in mind that styles can vary and be customized at different zoom levels: labels can be made to appear or not, colors can change, and features can be emphasized or de-emphasized. This will allow you to create a map that offers the right level of detail for users and will allow you to focus their attention on certain map elements. Keep in mind too that this map is essentially a backdrop for the information you will be adding to it later, so it should complement and not compete for attention.
Consider what you would want your initial frame of your map to be. Will you keep the same scale at each point, or will you zoom in? Do you want to maintain the same top-down view, or will you ever want to rotate the map? In the address bar, you can see the current zoom level and center of the map after the # symbol.

In this example, the 13.81 is the zoom level, and the 40.74921 and -73.97228 are the latitude and longitude, respectively. We will use attributes like these later on in our web map to determine the initial view, as well as any subsequent views.
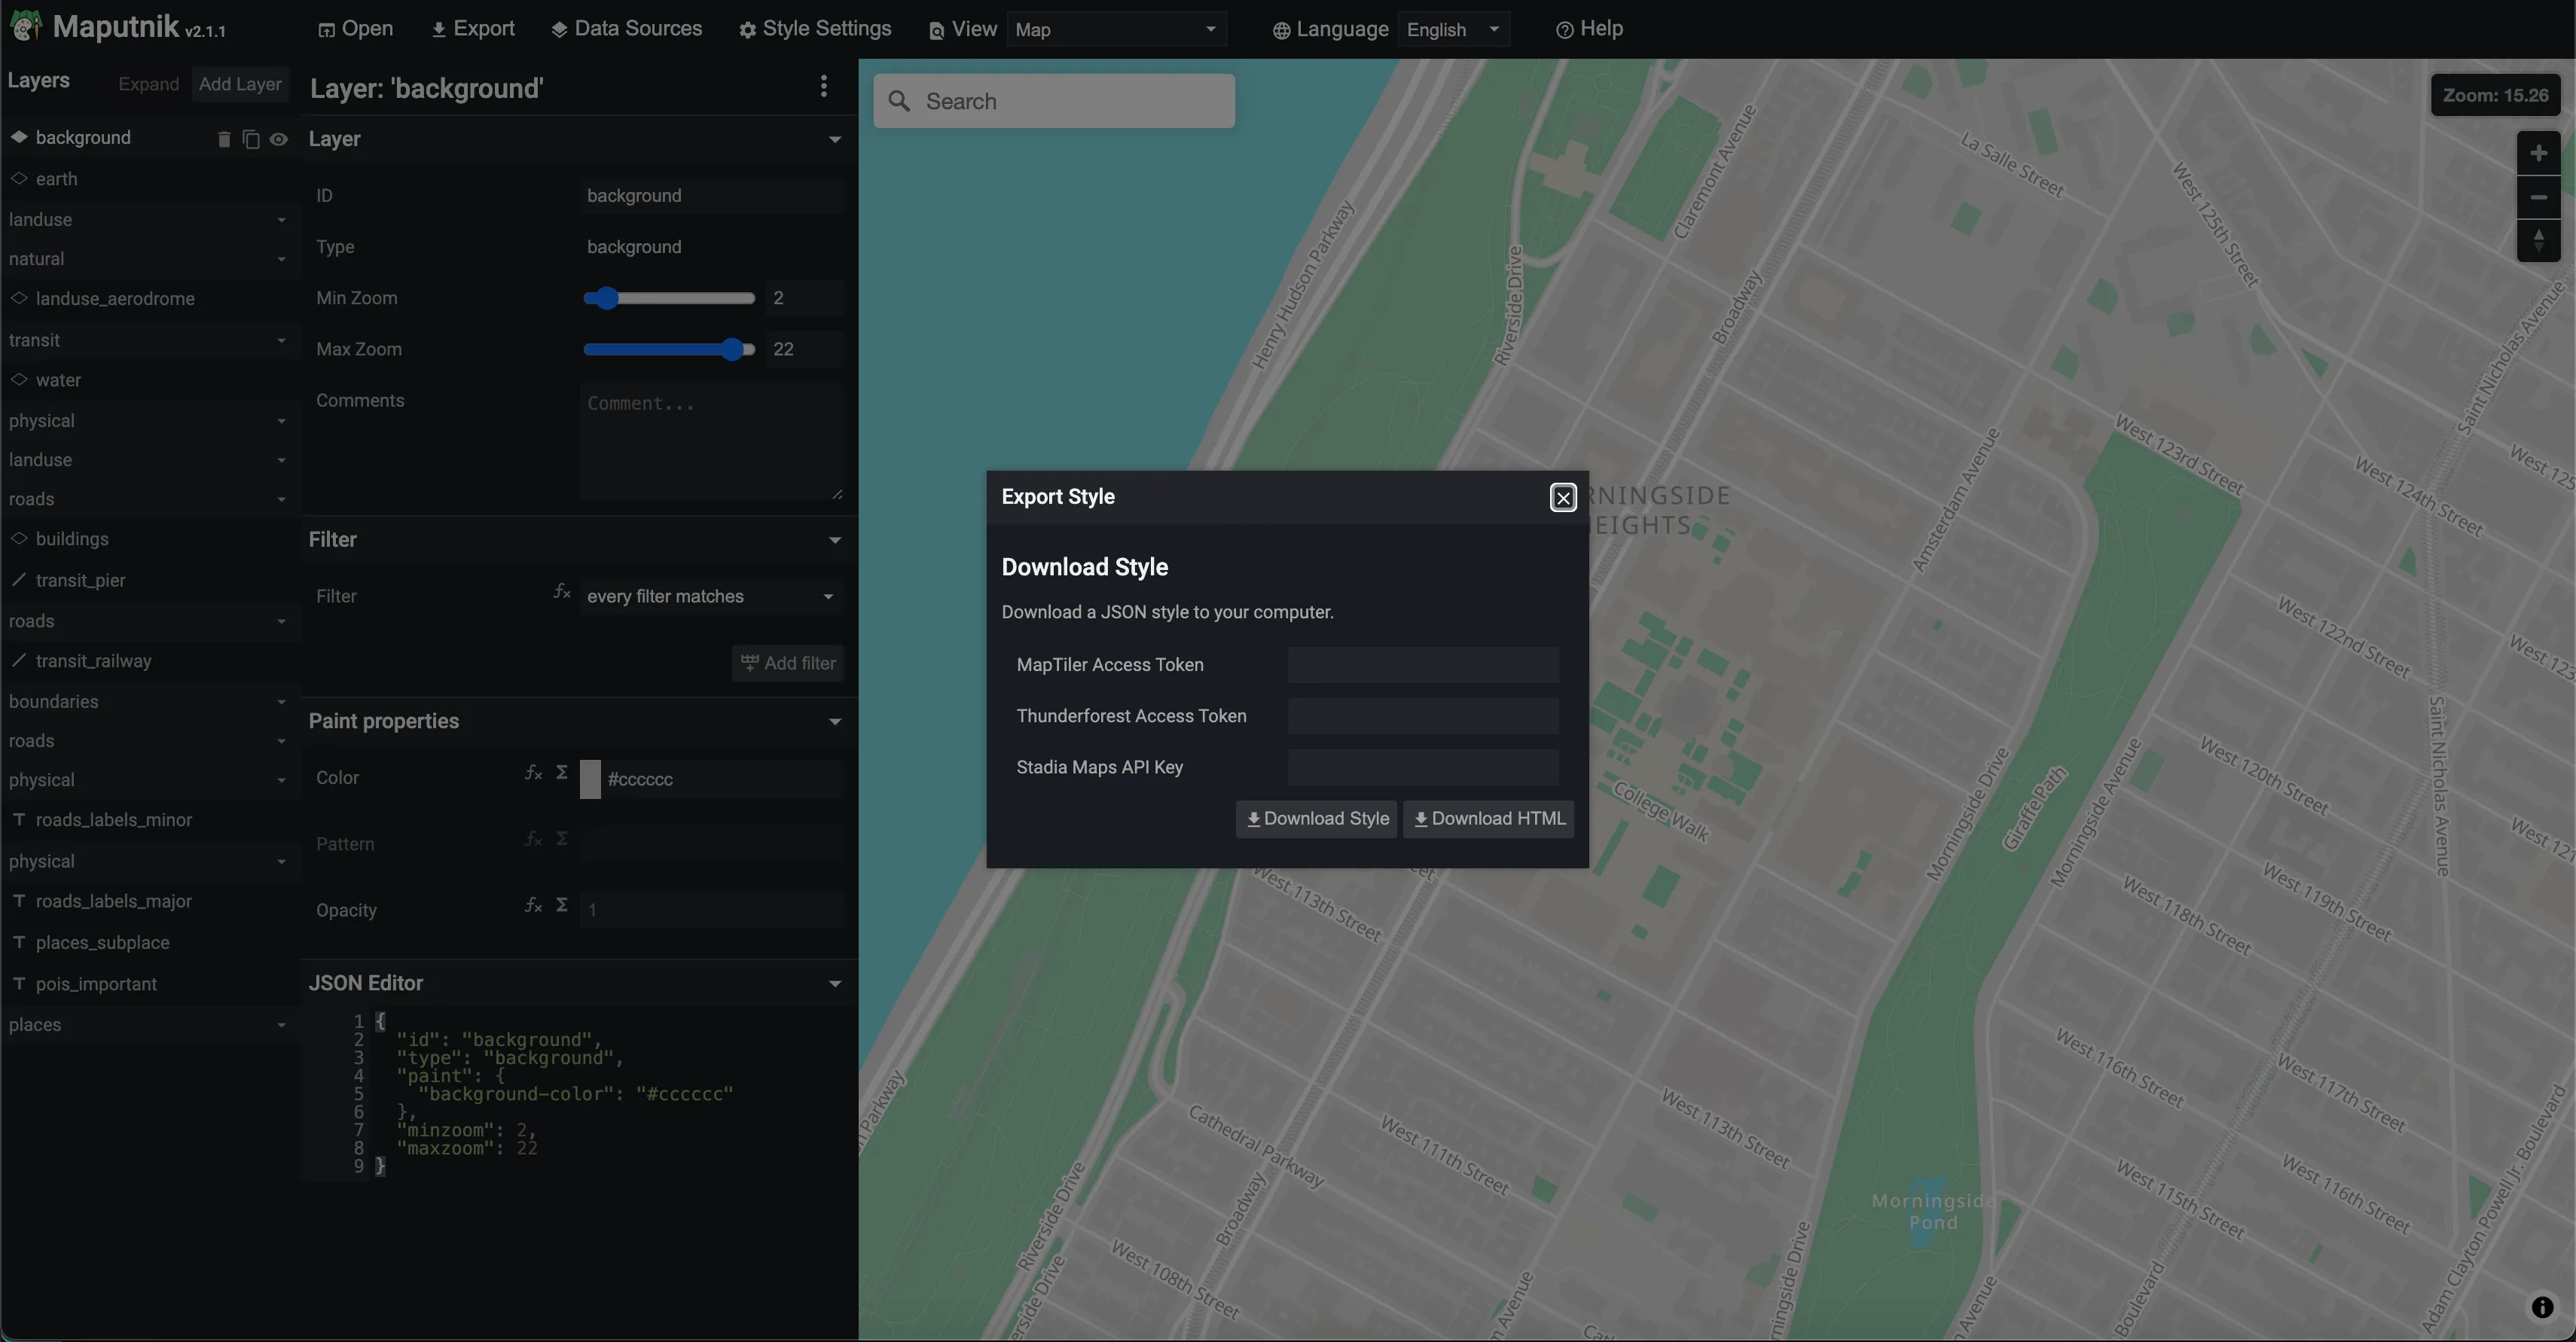
Finally, click on the Export button at the top of the screen. This will download a style.json file to your computer. Don’t worry about providing an API key, the file will still download.

Open the file in the text editor you downloaded earlier. You’ll see a JSON object that describes the visual appearance of the map. This file will be used in later exercises to create an interactive web map.
Wrapping up
Please submit the following to Canvas:
- Your Github username so we can add you to the class organization
- A copy of the
style.jsonfile you created in Maputnik.