08.2 Interactive Mapping Part 2
This tutorial will help you publish a web map using the style you created in the last exercise, along with Maplibre, Astro, Github, and Github Pages.
Maplibre is a free and open-source fork of Mapbox GL JS, which is a JavaScript library for creating interactive web maps. Maplibre is a powerful tool that allows you to create custom web maps with a wide range of features, such as custom styles, vector tiles, and interactivity. Astro is a static site generator that allows you to build websites using modern web technologies like React and Vue, but outputs static HTML, CSS, and JavaScript files. This makes it well-suited for web mapping, as it allows you to create interactive web maps without the need for a server or database. Github Pages is a free service offered by Github that allows you to host static websites for free. You can publish your map to the web using Github Pages, allowing you to share your work with others.
Deliverables
- Link to your github repository, containing the code for your web map.
Data
- None
Getting Started
-
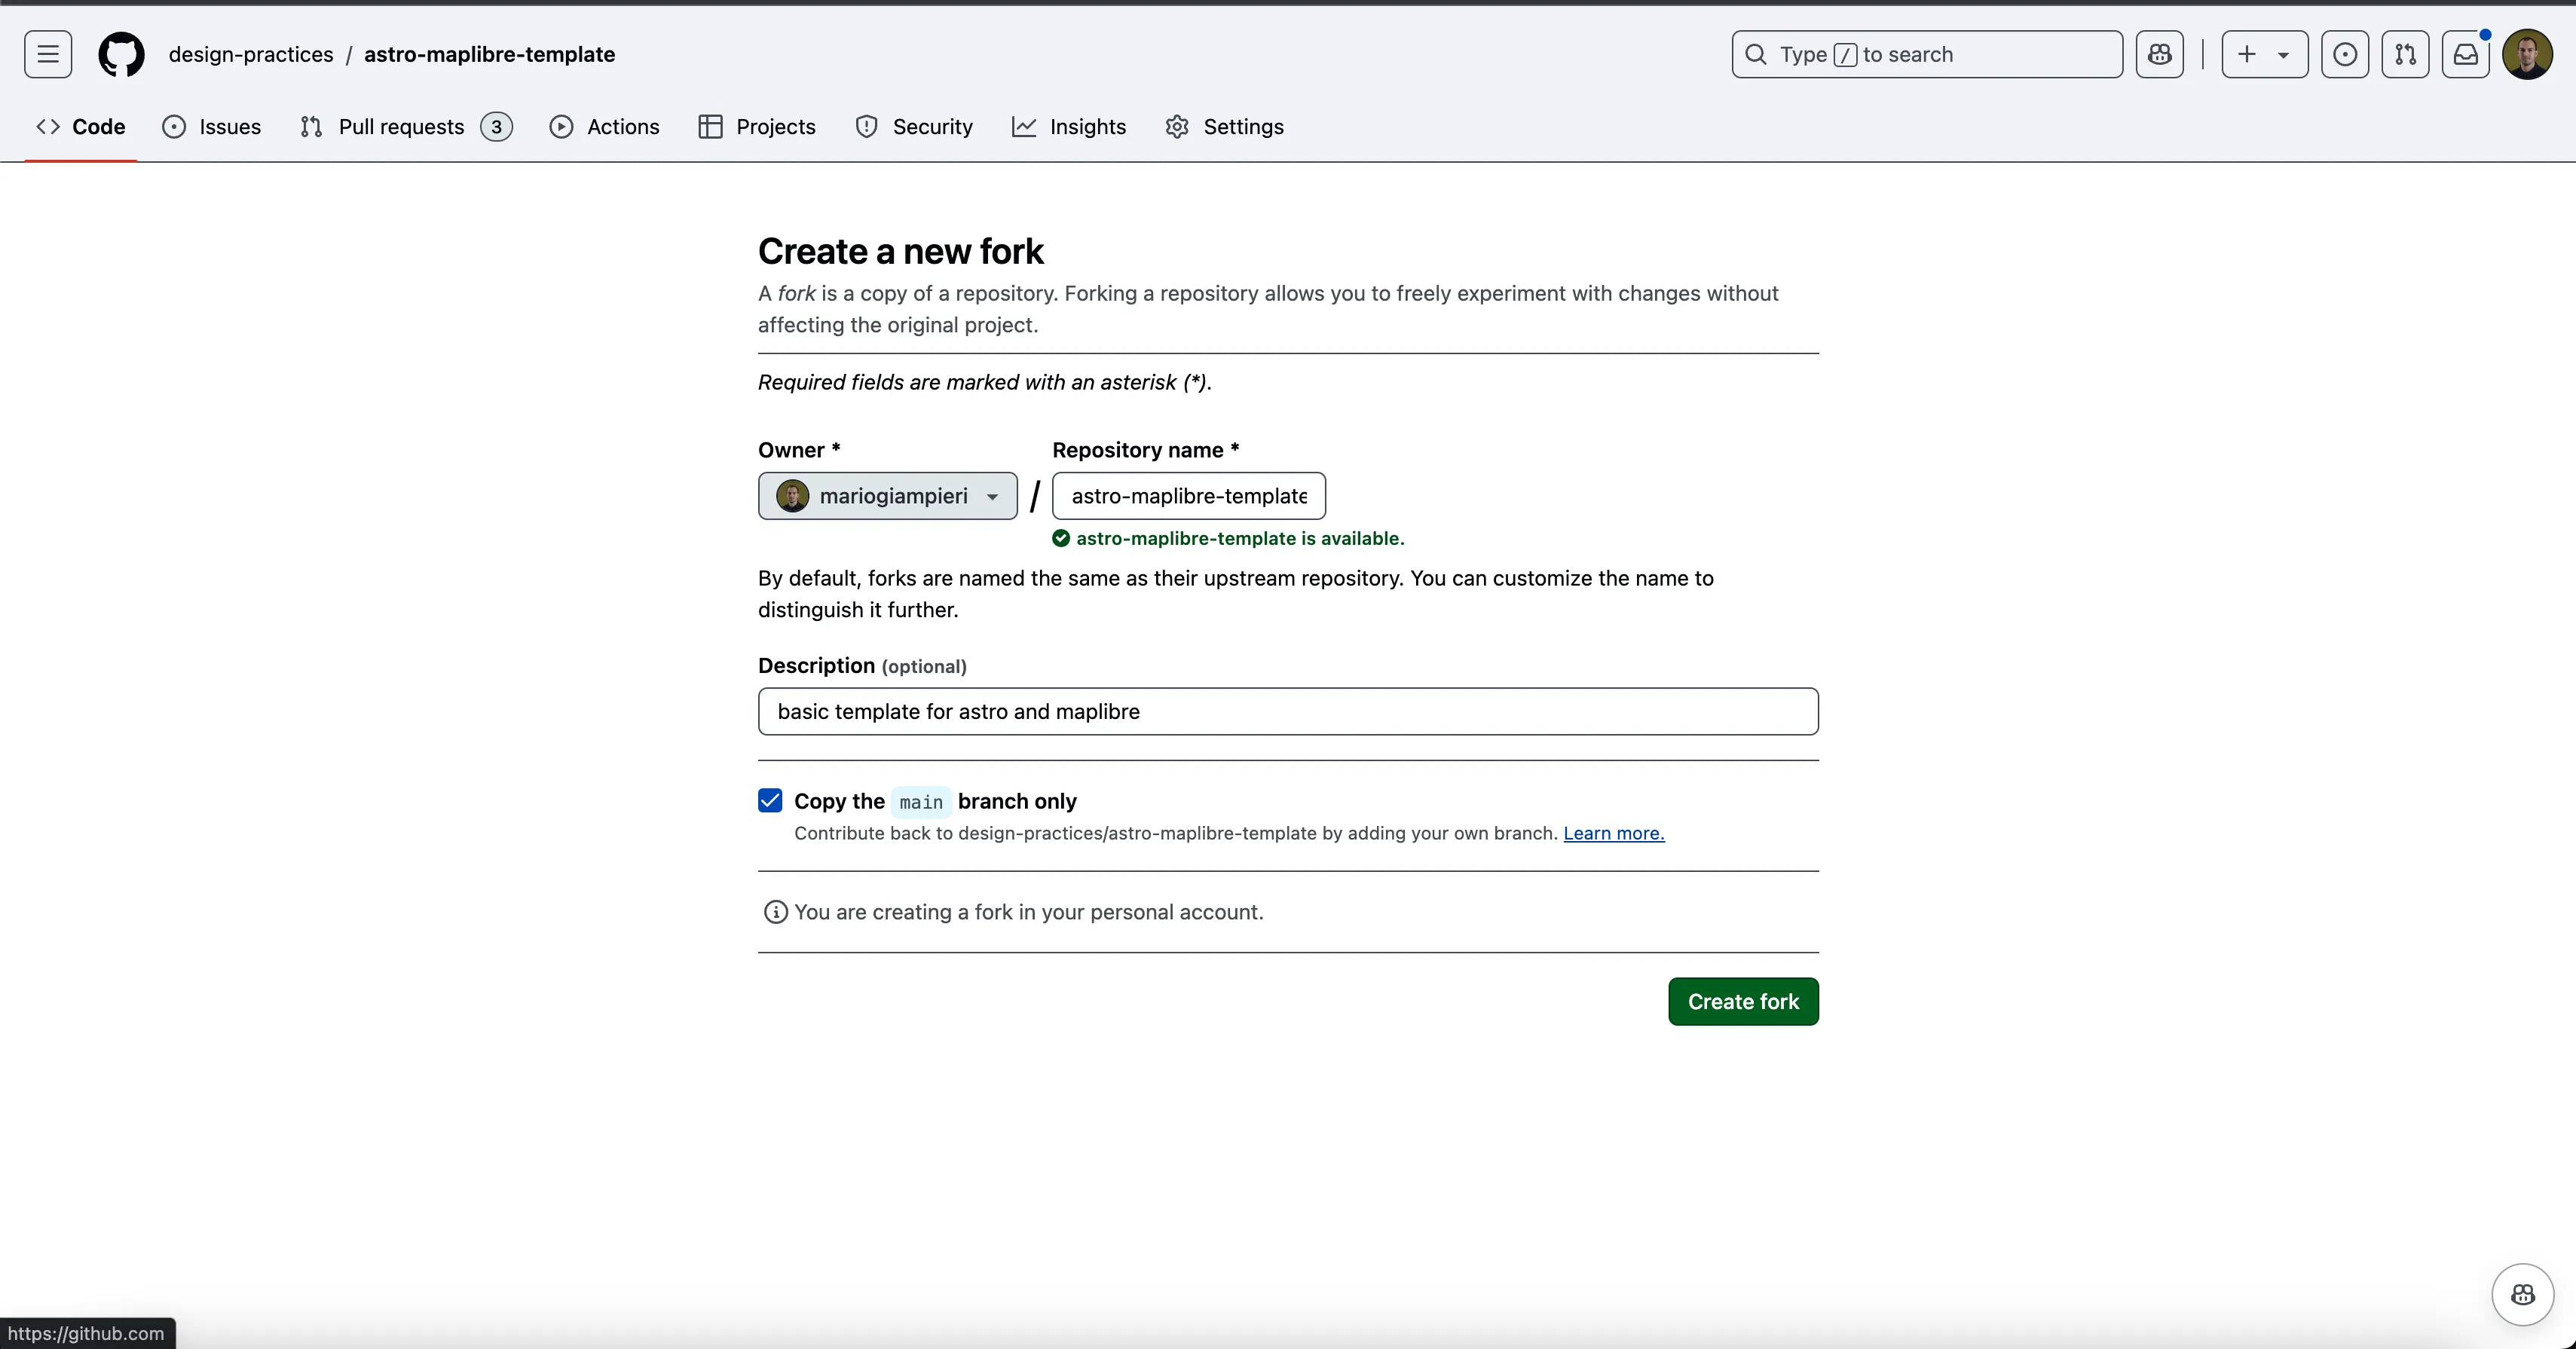
Navigate to the course webmap template repository and click the “Fork” button. This will create a copy of the repository in your Github account that you can edit. Leave the repository name as the default; (if you choose to not do so, you will have to make additional changes to your page navigation). Keep the other default settings.
-
Now that you have your own working copy of the repository, use the online Github interface or the Github Desktop application to clone the repository to your local machine. This will create a copy of the repository on your computer that you can edit using a text editor. See here for instructions on how to clone a repository.
-
Open the repository in the text editor you downloaded last week. You will see a wide range of files and folders, which adhere to the structure of a typical Astro project. Astro is a static site generator that allows you to build websites using modern web technologies like React and Vue, but outputs static HTML, CSS, and JavaScript files. This makes it well-suited for web mapping, as it allows you to create interactive web maps without the need for a server or database. Through this course, we will only scratch the surface of what Astro can do, but it is a powerful tool that you may want to explore further in the future.
Adding your map style file
Open the /public folder in the file tree. The public folder is where you will store any static assets that you want to include in your website, such as images, fonts, and map styles, as well as geojson layers (more on that layer). Drag and drop your style.json file into this folder.
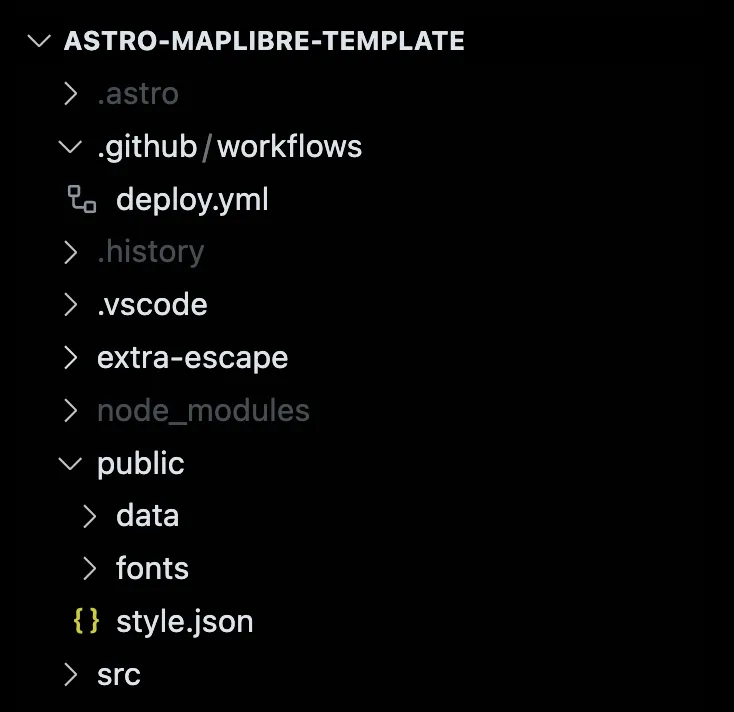
You can either right click on public to open the folder location, or find it in your file tree.
Adding your map style to the map
For this initial example, we will create a full page map, with two sample layers, to demonstrate the process of adding a map style to a web map and loading layers.
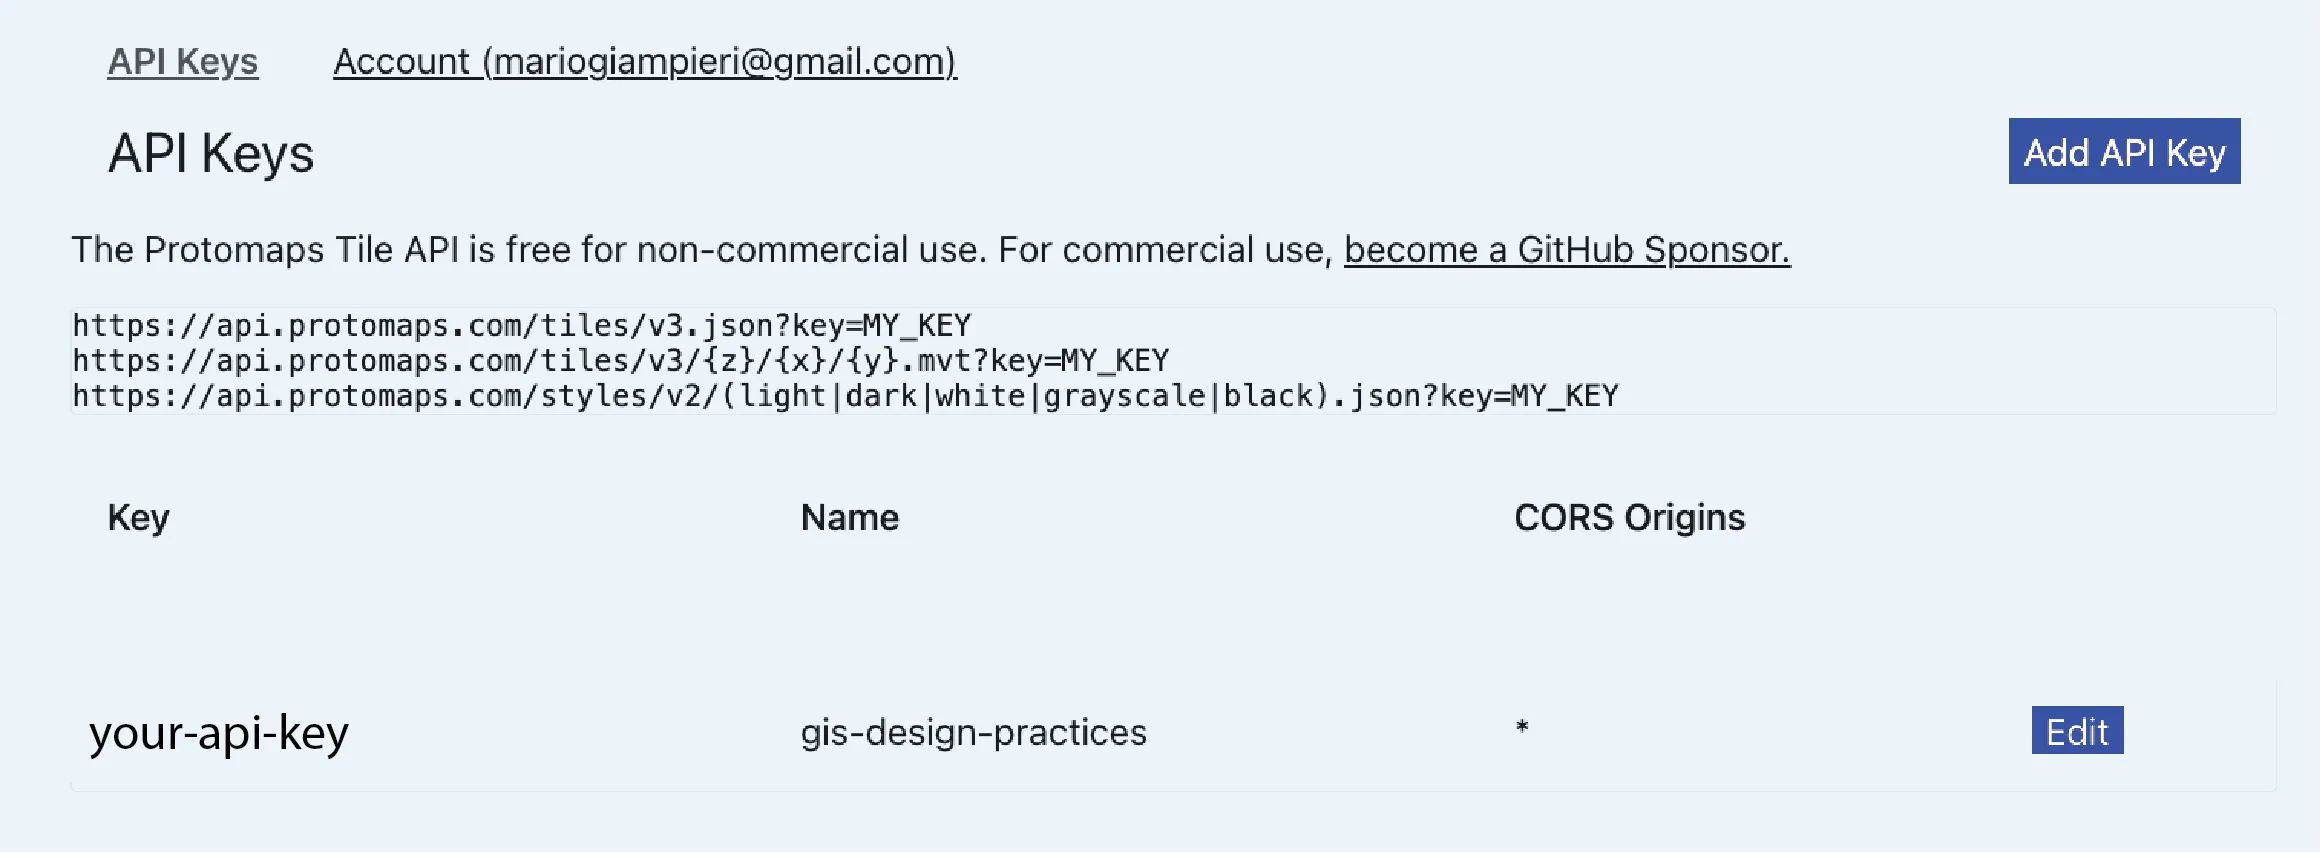
First, we need to obtain an API key from Protomaps to be able to use their tile server. Go to Protomaps and sign up for an account. Once you have an account, you can generate an API key by clicking on the “Add API Key” button. Give your key a name (e.g. g4dp-api-key) and leave the other settings as default. Copy the API key to your clipboard. The key will be a 16-digit alphanumeric string.
Note: Your map style may be based on another provider besides Protomaps. If you are using a different tile server, you will need to obtain an API key from that provider and follow their instructions for adding the key to your map style. Look at the base url in your style.json file to determine which tile server you are using. If, for example, you are using a MapTiler-based stlye, go to https://cloud.maptiler.com/maps/ instead to create an API key.
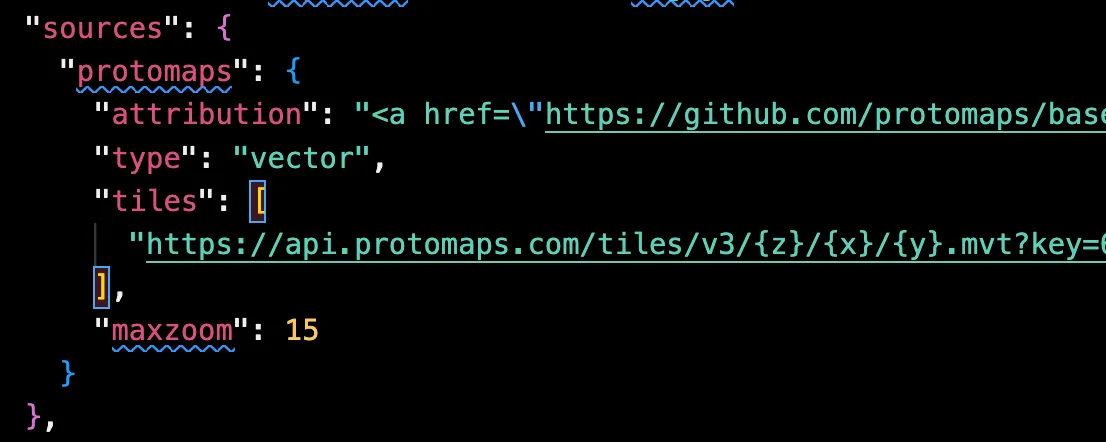
Open your style.json file. Toward the top of the JSON object, you will see a sources object with a protomaps source. Add your newly generated API key after key=, replacing the testing key generated by Maputnik:
Open src/pages/full_page_map.mdx. This file is written in MDX, which is a markdown syntax that allows you to embed React components. This is a powerful feature of Astro, as it allows you to write markdown files that contain interactive elements, such as maps, charts, and other visualizations. We have prepared a MapLibre map component that takes certain arguments to create a map.
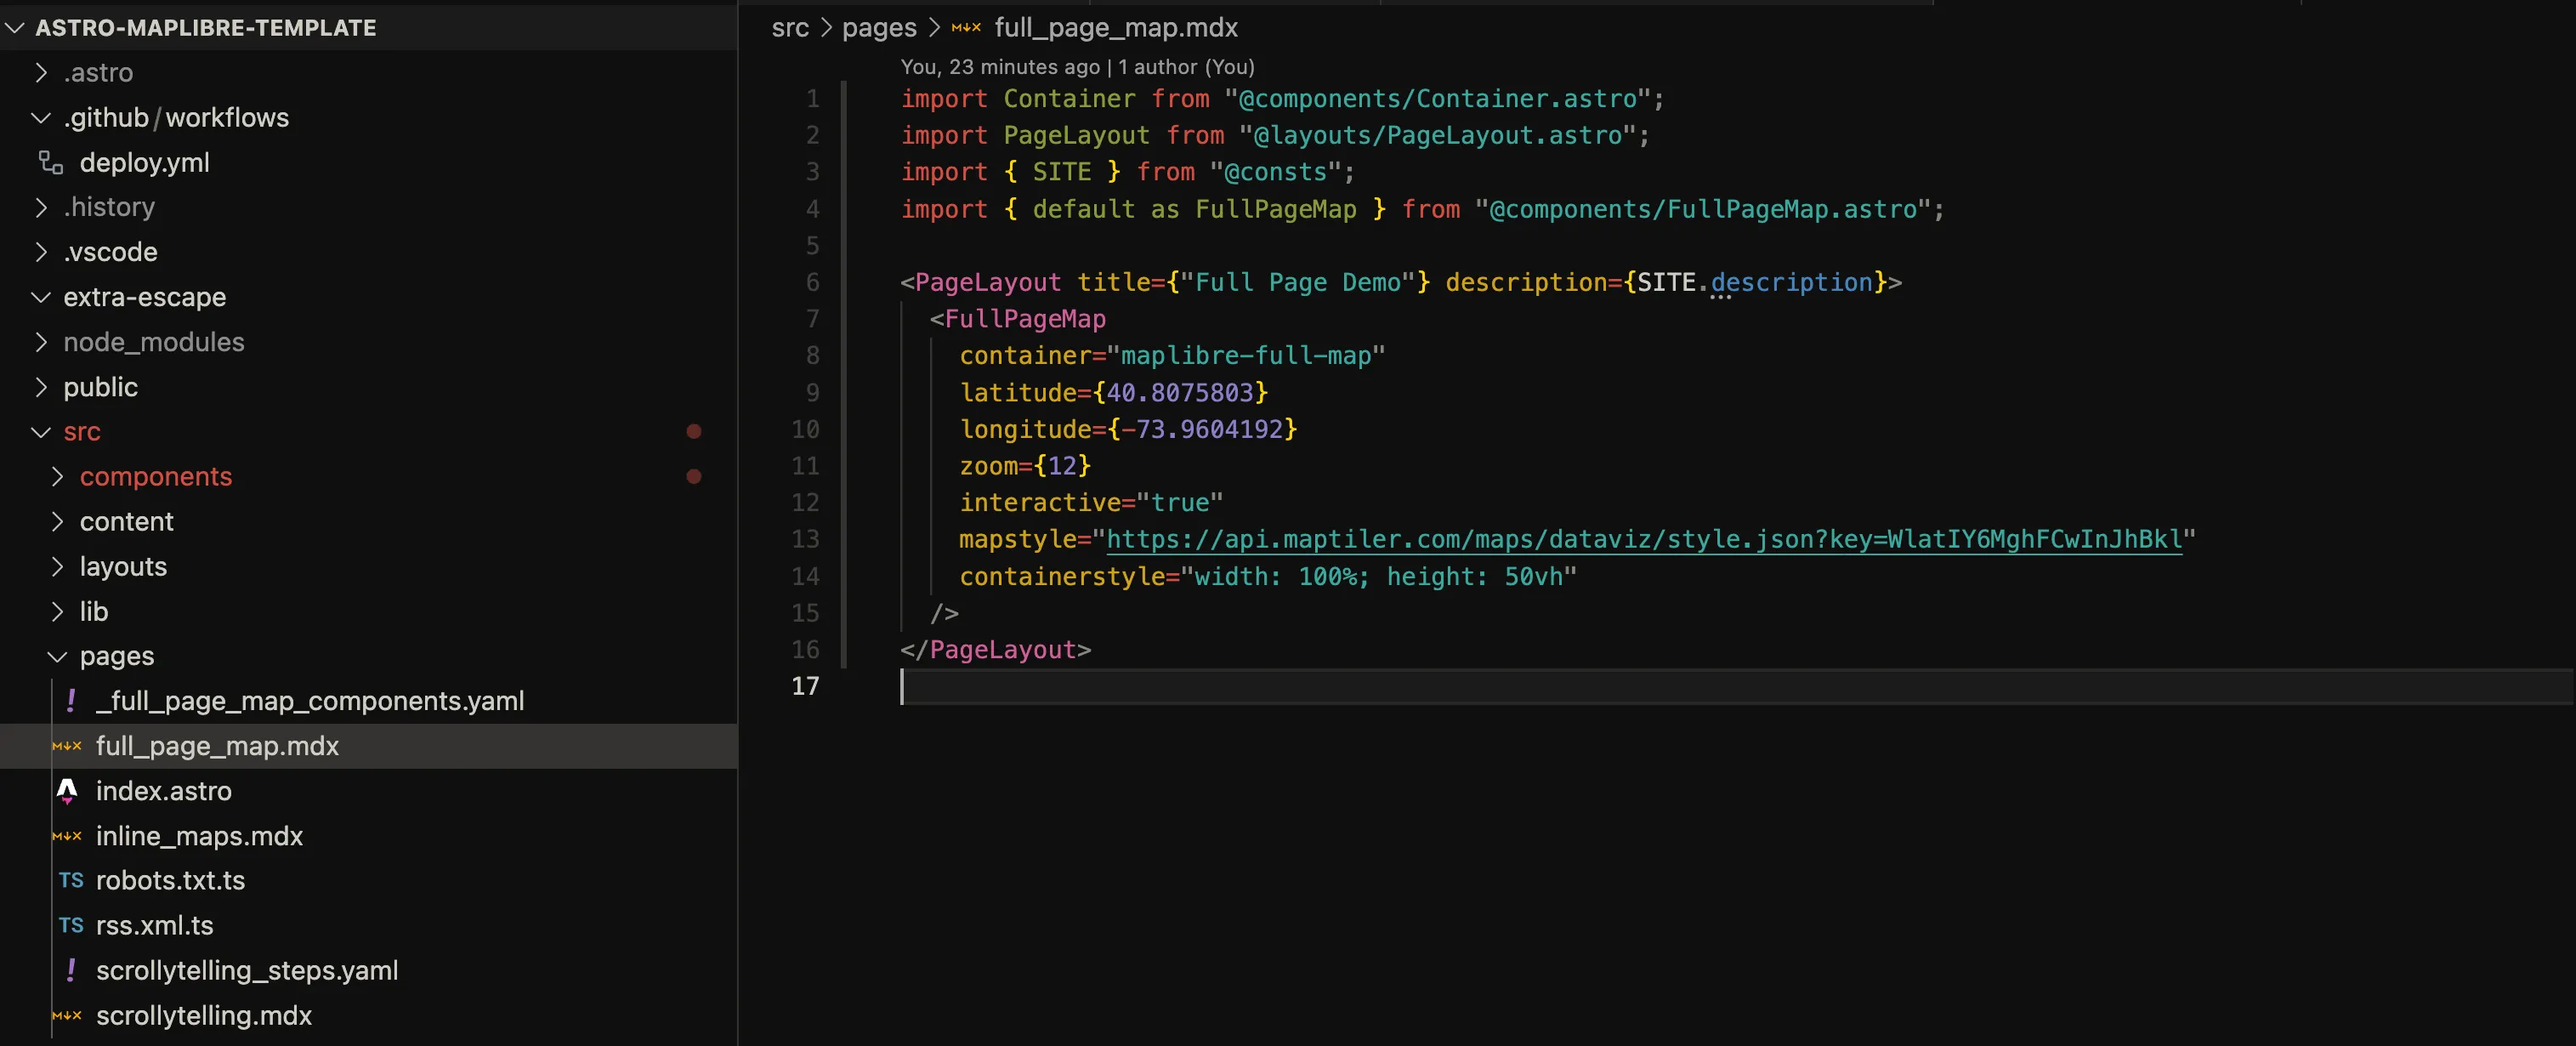
If you are familiar with HTML programming, you may recognize the structure of the <FullPageMap> component as similar to an HTML element. The component takes several arguments, including the map style, the initial center of the map, and the initial zoom level. The style is set to your style file, which should be "./style.json". The leading ./ tells the component to look for the file in public directory.
Separately, take note of the other arguments:
containeris the ID of the HTML element that the map will be rendered in. This is set tomaplibre-full-mapby default.latitudeandlongitudeare the initial center of the map. These are set to the coordinates of New York City by default.zoomis the initial zoom level of the map. This is set to 12 by default.interactive: if set totrue, the map will be interactive, allowing users to pan and zoom. If set tofalse, the map will be static. This is set totrueby default.containerstyleis the CSS style of the map container. This is set to a default style by default. You can change this to customize the appearance of the map container, and can add further css properties instyles/global.css.
Optional: install Astro to be able to run and test your map locally
Install NPM (Node Package Manager)
If you have not already done so, you will need to install Node.js and npm to be able to run and test your map locally. You can download the installer from the Node.js website. Follow the instructions to install Node.js and npm on your computer. Essentially, this will allow you to run JavaScript code on your computer, and will allow you to install the necessary dependencies for your project.
Install Astro
If you have not already done so, you will need to install Astro to be able to run and test your map locally. Open a terminal window and navigate to the root directory of your project. Run the following command to install the necessary dependencies:
cd path/to/your/project
npm install
In the above example, cd is a command that stands for “change directory”, and path/to/your/project is the path to the root directory of your project. You will need to replace this with the actual path to your project. You can copy and paste the path from the address bar of your file explorer, or right-click on the project folder and select “Copy path”.
npm install is a command that tells npm to install the dependencies for your project. This will install the necessary dependencies for your project, including Astro. You can see the full list of packages that will be installed in the package.json file. Once the installation is complete, you can run the following command to start the development server:
npm run devnpm run dev tells npm to run the dev script in the package.json file. You can see what subcommands it runs, as well as what other commands are available in the package.json file.
This will start the development server, which will watch for changes to your files and automatically update the browser. You can open a web browser and navigate to http://localhost:4321/astro-maplibre-template/full_page_map to see your map. You can make changes to your files and see the changes reflected in the browser in real-time.
If this is too confusing or you encounter issues, do not despair: you can bypass local previews and publish directly to your website. The tradeoff is that you will not be able to see changes in real-time, but you can still make changes to your files, commit them to your online repository, and see the results by refreshing the page.
Adding layers to your map
Navigate to src/pages/_full_page_map_components.yaml. A YAML file is a human-readable data serialization format that is commonly used for configuration files. This file contains the configuration for the layers that will be added to the map.

In general, the layers adhere to the Mapbox layer specification, with information on layer source, type, and style properties.
Each layer has the following properties:
id: a unique identifier for the layerlabel: the name of the layer that will be displayed in the layer switchertoggle: whether you want to allow your users to switch the layer on and offvisible: whether the layer is visible by defaultdata-type: the type of data that the layer represents. Leave this asgeojsonfor now.layer-type: the type of layer. This can befill,line,circle, orsymbolurl: the path to the layer data. This should be a path to a GeoJSON file in thepublicfolder, or to a remote url as shown here.paint: the style properties for the layer. This is where you can customize the appearance of the layer, such as the color, opacity, and width of the lines. See the Mapbox style specification for more information on the available style properties.
Note that the key words and indentation are important in YAML files. If you are unfamiliar with YAML, you can read more about it here.
Publishing your map
Once you are happy with your map, you can publish it to the web using Github Pages. This is a free service offered by Github that allows you to host static websites for free. You can publish your map by following these steps:
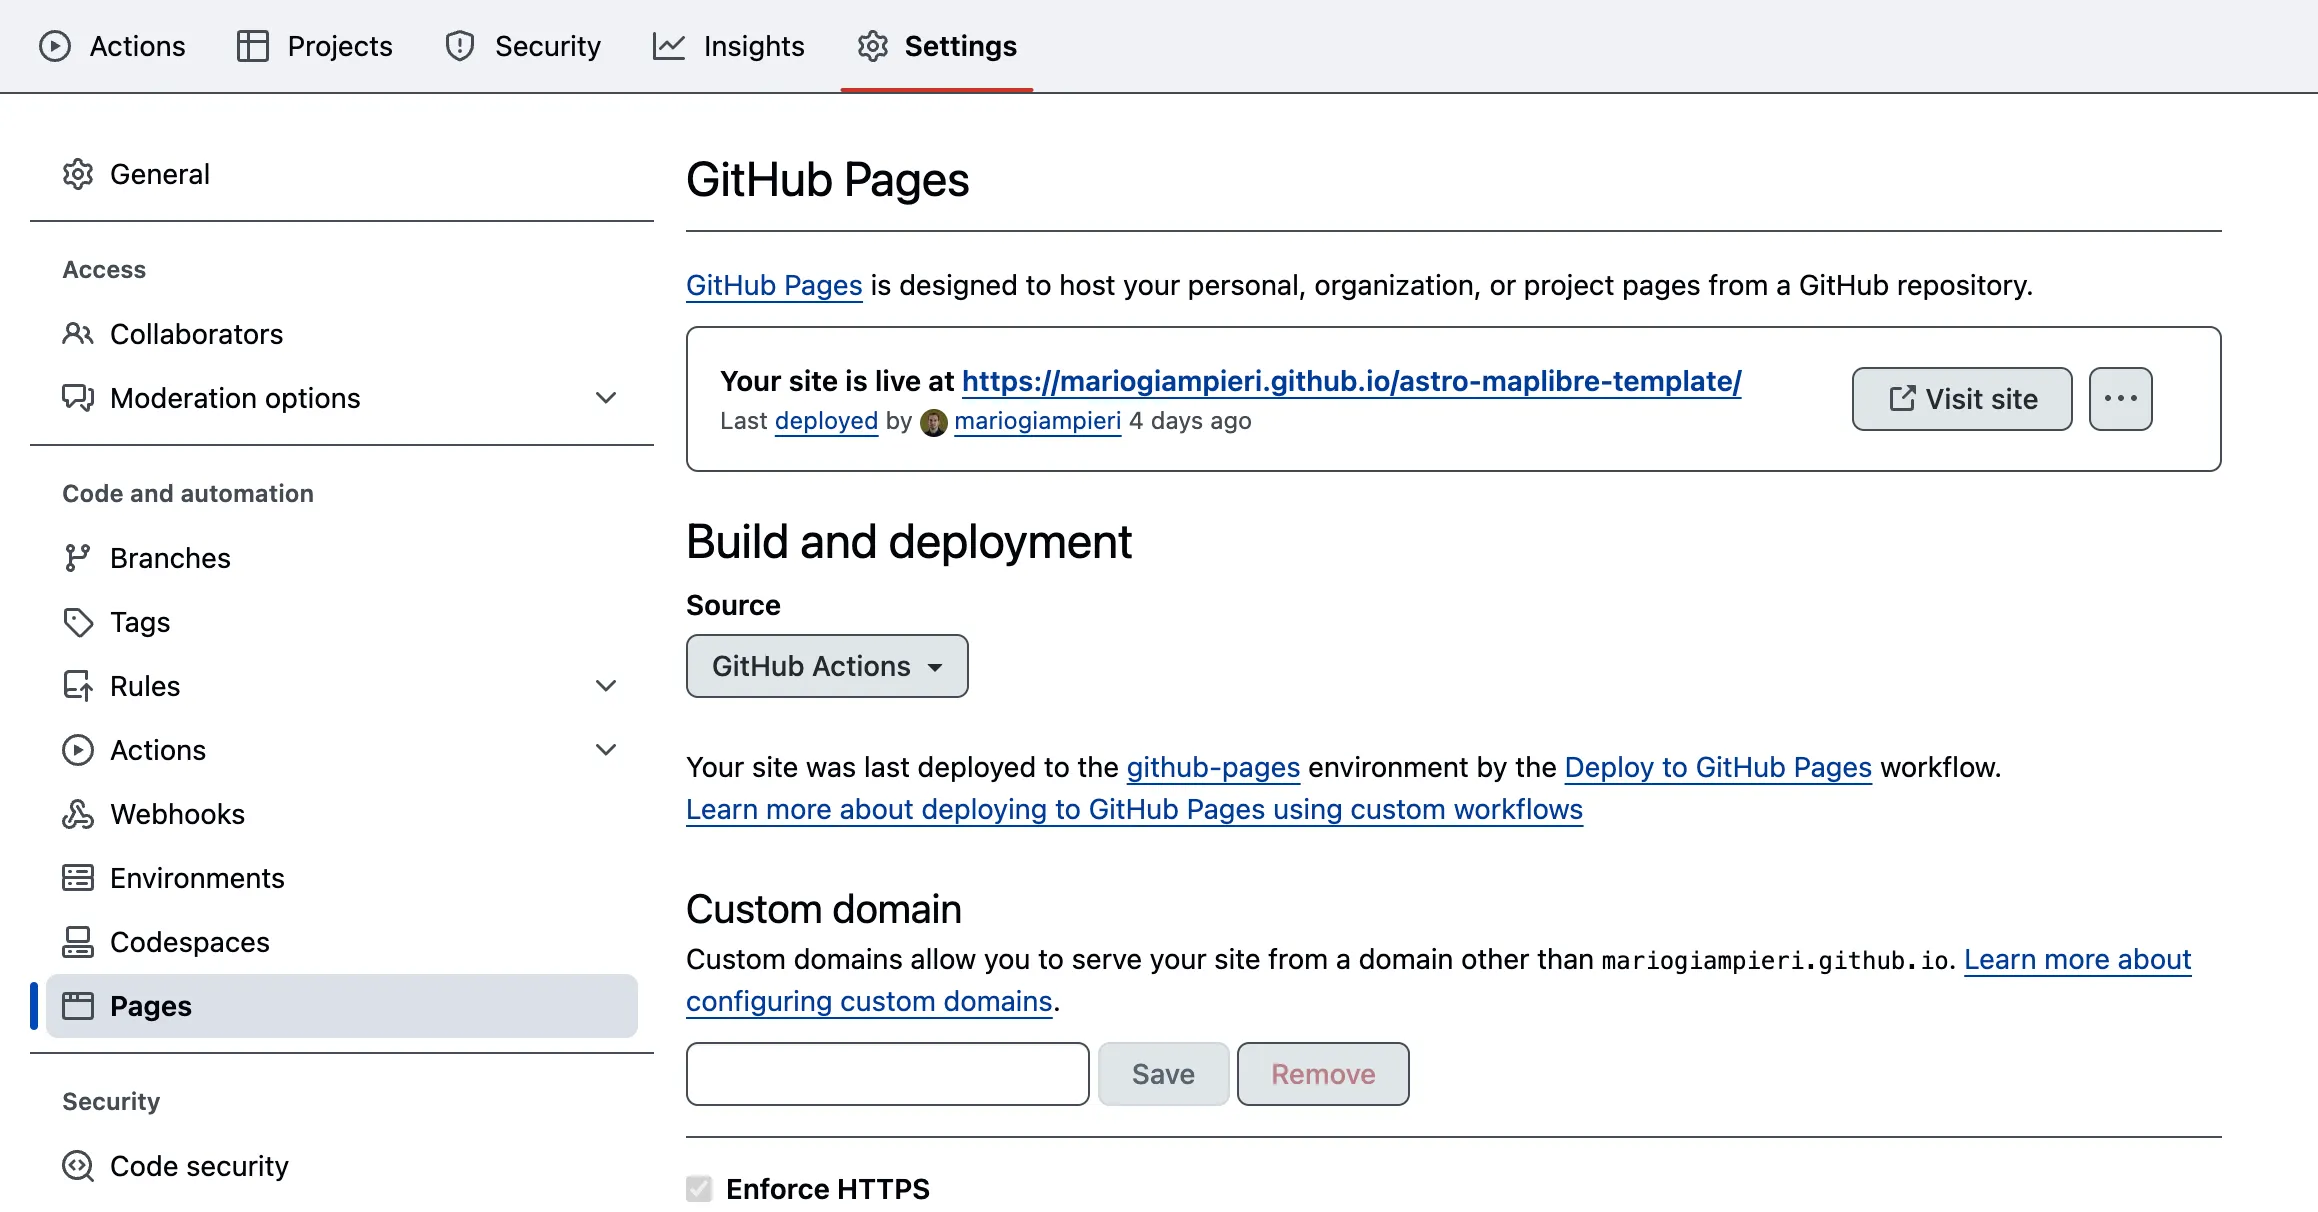
- Enable Github Pages for your repository. In the Github web interface, navigate to the “Settings” tab of your repository. From the left side menu select “Pages.” Select the option to enable Github Pages for your repository. Then from the Source drop down menu select “GitHub Actions”. You have now enabled Github Pages functionality for your repository and can proceed to configure and then publish you map.
- In your text editor, open the
astro.config.mjsfile in the root directory of your project. You’ll see a variable calleddefineConfig, with asiteand abasevariables. You must update thesitevariable to match your Github username, and leave thebasevariable alone for now.

In this example, replace design-practices with your username.
- Commit your changes to your repository. You can do this using the Github Desktop application by selecting the files you want to commit, entering a commit message, and clicking the “Commit” button. Then, click the “Push origin” button to push your changes to your online repository.
- “In the Github web interface, navigate to the “Actions” tab of your repository. If you are presented with a message that says “Workflows aren’t being run on this forked repository” click the green button that says
I understand my workflows, go ahead and enable them. You should then see an action listed in the left hand menu calledDeploy to GitHub Pages— click on this workflow to see a list of individual actions that have been run through this workflow. You will see an action running that matches the commit message you just made (in this example, “update config”). This action will build your website and deploy it to Github Pages.”
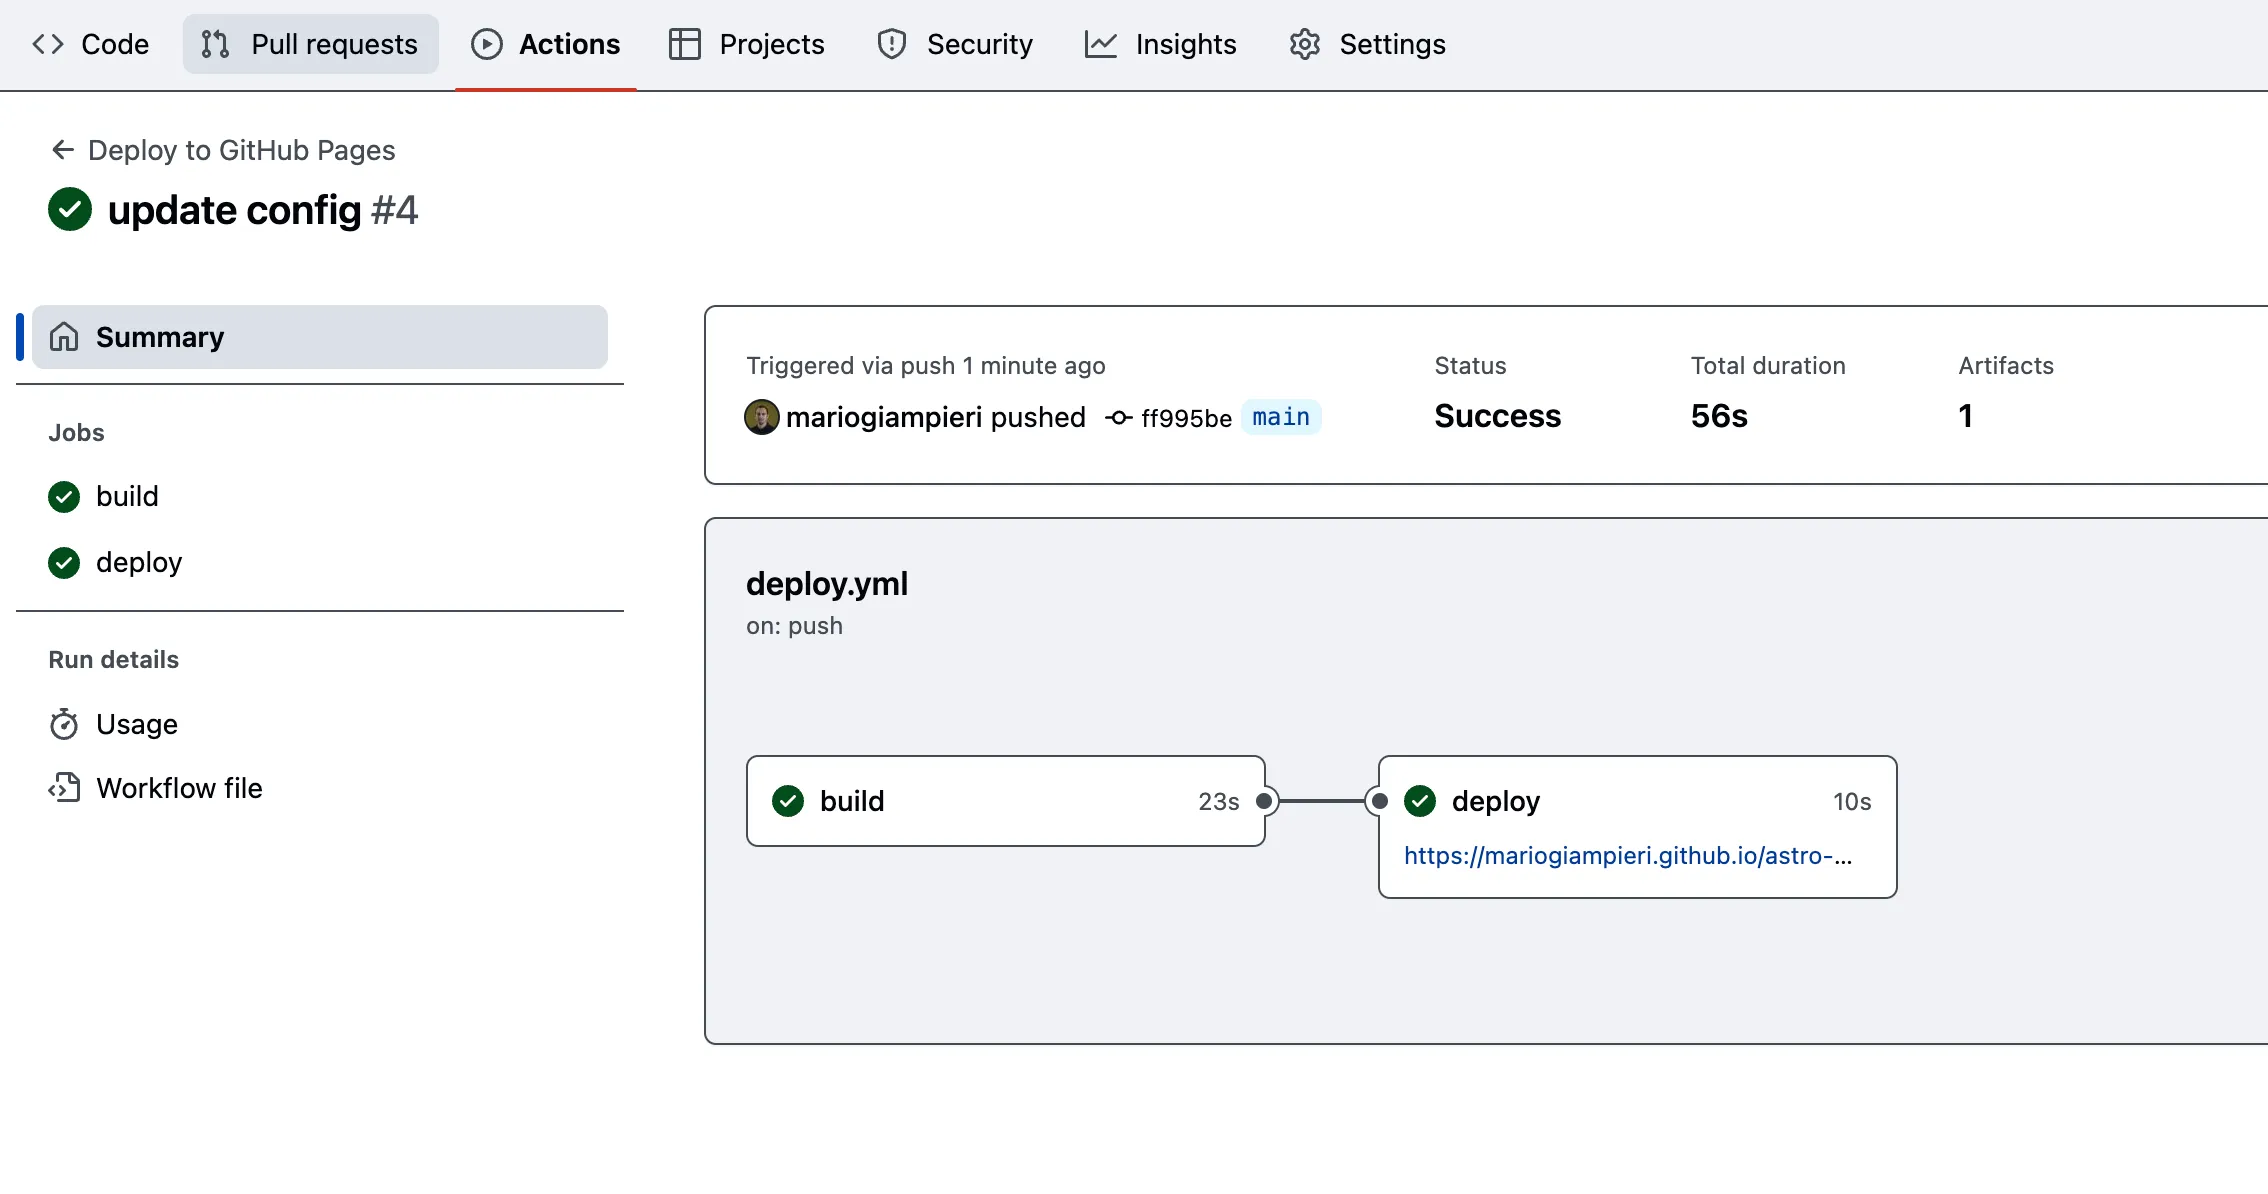
- If you’re curious, you can click on either the
buildordeploynodes to see the steps that are being taken behind the scenes to compile your website and deploy it to Github Pages. This will give you a sense of the process that is happening when you runnpm run ***commands (in this case,npm run build). Finally, the url you see in thedeploynode is the url where your website will be published. You can click on this link to see your website live on the web.
As you make changes to your files in the coming days and weeks, you will replicate this process and continue to build on these template files. For the sake of the tutorial, we have added two remote layers to demonstrate how you can add layers to your map.
Deliverables
- Link to your github repository, containing the code for your web map.
- A link to your published web map. This should be available at
https://<your-username>.github.io/astro-maplibre-template/full_page_mapwhere<your-username>is your Github username.